
Dokploy 安全与监控体系完整部署指南:CrowdSec + Traefik + Grafana
Dokploy 的第三弹文章来啦!以下为本人所使用的安全规则和配置。
本文记录了在 Dokploy 环境中构建完整安全与监控体系的实践经验,涵盖 CrowdSec 威胁检测、Traefik 与 Cloudflare 集成、以及基于 Grafana/Loki/VictoriaMetrics 的可观测性平台。所有配置均可直接复刻使用。
Dokploy 系列文章:
- Dokploy 部署和使用教程 - 第一篇:从零开始部署 Dokploy
- 使用 Cloudflare R2 配置 Dokploy 备份 - 第二篇:自动备份配置
- 本文 - 第三篇:安全与监控体系
架构概述
整个体系由三大核心模块组成:
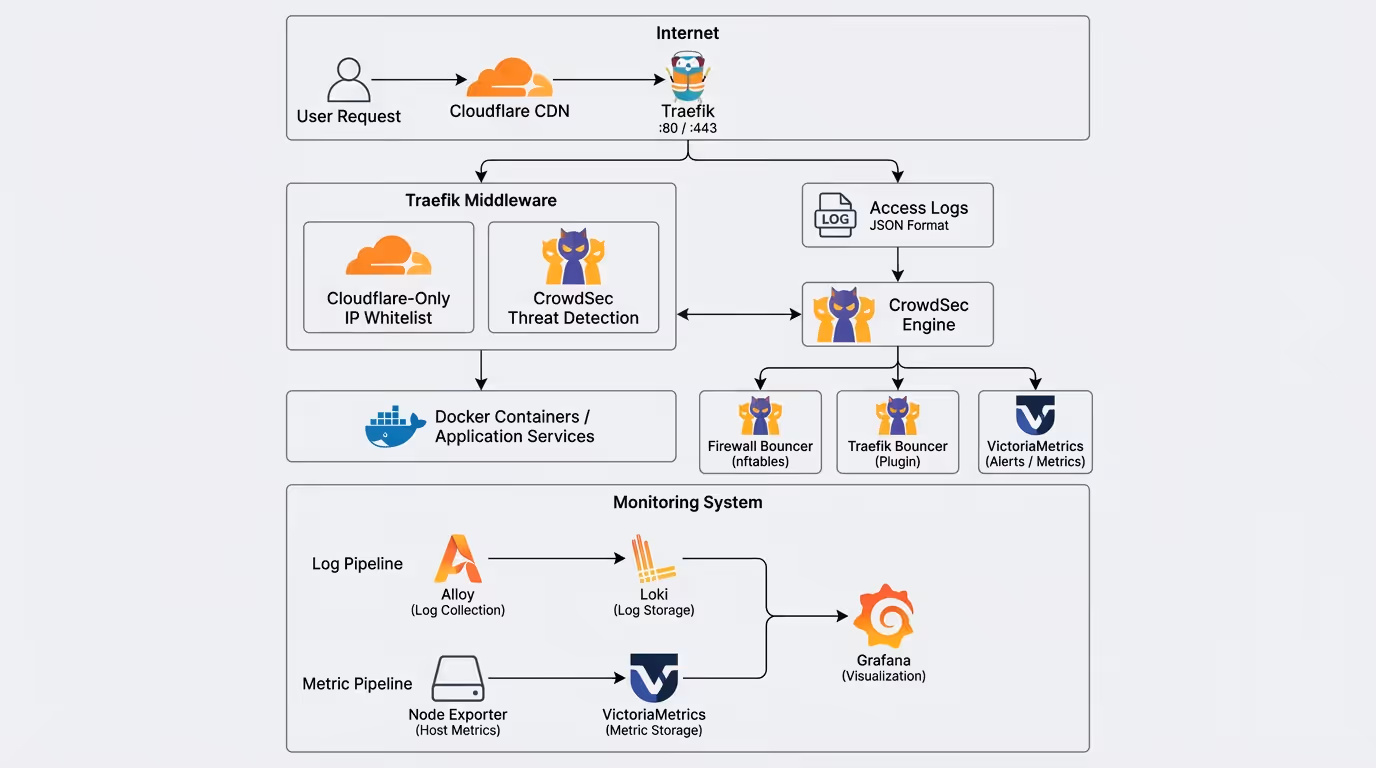
┌─────────────────────────────────────────────────────────────────────────┐│ Internet ││ 用户请求 ──► Cloudflare CDN ──► Traefik (:80/:443) │└─────────────────────────────────────────────────────────────────────────┘ │ ┌─────────────────┴─────────────────┐ ▼ ▼ ┌───────────────────┐ ┌─────────────────┐ │ Traefik 中间件 │ │ 访问日志 │ │ ┌───────────────┐ │ │ (JSON格式) │ │ │Cloudflare-Only│ │ └────────┬────────┘ │ │ IP白名单 │ │ │ │ └───────────────┘ │ ▼ │ ┌───────────────┐ │ ┌─────────────────┐ │ │ crowdsec │◄├─────────────────│ CrowdSec │ │ │ 威胁检测 │ │ │ Engine │ │ └───────────────┘ │ └────────┬────────┘ └─────────┬─────────┘ │ │ ┌──────────────┼──────────────┐ ▼ ▼ ▼ ▼ ┌─────────────────┐ ┌─────────────┐ ┌─────────────┐ ┌─────────────┐ │ Docker 容器 │ │ Firewall │ │ Traefik │ │VictoriaMetrics│ │ 应用服务 │ │ Bouncer │ │ Bouncer │ │ 告警通知 │ └─────────────────┘ │ (nftables) │ │ (Plugin) │ └─────────────┘ └─────────────┘ └─────────────┘
┌─────────────────────────────────────────────────────────────────────────┐│ 监控体系 ││ ┌─────────────┐ ┌─────────────┐ ┌─────────────┐ ││ │ Alloy │───►│ Loki │───►│ Grafana │ ││ │ 日志采集 │ │ 日志存储 │ │ 可视化 │ ││ └─────────────┘ └─────────────┘ └──────┬──────┘ ││ ┌─────────────┐ ┌─────────────┐ │ ││ │Node Exporter│───►│VictoriaMetrics│─────────┘ ││ │ 主机指标 │ │ 指标存储 │ ││ └─────────────┘ └─────────────┘ │└─────────────────────────────────────────────────────────────────────────┘组件职责
| 组件 | 职责 | 数据保留 |
|---|---|---|
| CrowdSec Engine | 威胁检测引擎,分析日志识别恶意行为 | - |
| Firewall Bouncer | 主机层防火墙,使用 nftables 阻止恶意 IP | - |
| Traefik Bouncer | 应用层防护,在请求进入时实时阻止 | - |
| Loki | 日志聚合存储 | 14 天 |
| VictoriaMetrics | 时间序列指标存储 | 90 天 |
| Alloy | 日志采集器,支持多种日志源 | - |
| Node Exporter | 主机性能指标采集 | - |
| Grafana | 统一可视化面板 | - |
第一部分:CrowdSec 安全防护
1.1 CrowdSec 简介
CrowdSec 是一个开源的协作式安全引擎,通过分析日志检测恶意行为,并通过 Bouncer 执行封禁决策。其特点包括:
- 行为分析:基于场景的威胁检测
- 社区共享:全球威胁情报共享
- 多层防护:支持防火墙和应用层 Bouncer
- 轻量高效:使用 Go 编写,资源占用低
1.2 在 Dokploy 中部署 CrowdSec
创建一个 Compose 服务,使用以下配置:
services: crowdsec: image: crowdsecurity/crowdsec:latest environment: GID: "${GID-1000}" COLLECTIONS: "crowdsecurity/linux crowdsecurity/traefik crowdsecurity/http-cve" volumes: - crowdsec-db:/var/lib/crowdsec/data/ - crowdsec-config:/etc/crowdsec/ - ../files/acquis.yaml:/etc/crowdsec/acquis.yaml - ../files/victoriametrics.yaml:/etc/crowdsec/notifications/http_victoriametrics.yaml - ../files/profiles.yaml:/etc/crowdsec/profiles.yaml - /etc/dokploy/traefik/dynamic/access.log:/var/log/traefik/access.log:ro - /var/log/auth.log:/var/log/ssh/auth.log:ro security_opt: - no-new-privileges:true ports: - "127.0.0.1:8080:8080" # LAPI - "127.0.0.1:6060:6060" # Prometheus metrics labels: - traefik.enable=false restart: unless-stopped networks: - default - dokploy-network
networks: default: dokploy-network: external: true
volumes: crowdsec-db: crowdsec-config:关键配置说明:
COLLECTIONS: 启用的检测集合,包括 Linux 系统、Traefik Web 和 HTTP CVE- 挂载 Traefik 访问日志供 CrowdSec 分析
- 挂载 SSH 认证日志检测暴力破解
- 端口仅绑定到 127.0.0.1,增强安全性
1.3 日志采集配置
创建 files/acquis.yaml 文件,定义 CrowdSec 要分析的日志源:
---# Traefik 访问日志采集filenames: - /var/log/traefik/access.logpoll_without_inotify: truelabels: type: traefik
---# SSH 认证日志采集filenames: - /var/log/ssh/auth.loglabels: type: syslog1.4 决策配置
创建 files/profiles.yaml 文件,定义封禁策略:
name: default_ip_remediationfilters: - Alert.Remediation == true && Alert.GetScope() == "Ip"decisions: - type: ban duration: 4hnotifications: - http_victoriametricson_success: break---name: default_range_remediationfilters: - Alert.Remediation == true && Alert.GetScope() == "Range"decisions: - type: ban duration: 4hnotifications: - http_victoriametricson_success: break配置说明:
- 检测到恶意 IP 后封禁 4 小时
- 支持单 IP 和 IP 段封禁
- 每次决策都通知到 VictoriaMetrics 用于监控
1.5 主机层 Firewall Bouncer
在主机上安装 Firewall Bouncer,使用 nftables 实现防火墙级别封禁:
# 安装curl -s https://install.crowdsec.net | sudo shapt install crowdsec-firewall-bouncer-nftables配置文件 /etc/crowdsec/bouncers/crowdsec-firewall-bouncer.yaml:
mode: nftablesupdate_frequency: 10slog_mode: filelog_dir: /var/log/log_level: infolog_compression: truelog_max_size: 100log_max_backups: 3log_max_age: 30api_url: http://127.0.0.1:8080/api_key: YOUR_API_KEY_HEREinsecure_skip_verify: falsedisable_ipv6: falsedeny_action: DROPdeny_log: falsesupported_decisions_types: - ban
blacklists_ipv4: crowdsec-blacklistsblacklists_ipv6: crowdsec6-blacklistsipset_type: nethashiptables_chains: - INPUTiptables_add_rule_comments: true
nftables: ipv4: enabled: true set-only: false table: crowdsec chain: crowdsec-chain priority: -10 ipv6: enabled: true set-only: false table: crowdsec6 chain: crowdsec6-chain priority: -10
nftables_hooks: - input - forward
prometheus: enabled: false listen_addr: 127.0.0.1 listen_port: 60601获取 API Key:
# 在 CrowdSec 容器中执行docker exec -it <crowdsec-container> cscli bouncers add firewall-bouncer1.6 Traefik Bouncer 插件
Traefik Bouncer 在应用层实现实时请求过滤。首先在 traefik.yml 中启用插件:
experimental: plugins: bouncer: moduleName: github.com/maxlerebourg/crowdsec-bouncer-traefik-plugin version: v1.4.6然后在中间件配置中使用:
http: middlewares: crowdsec: plugin: bouncer: enabled: true crowdsecMode: live crowdsecLapiKey: YOUR_TRAEFIK_BOUNCER_KEY crowdsecLapiHost: service-crowdsec-k5ws6c-crowdsec-1:8080获取 Traefik Bouncer Key:
docker exec -it <crowdsec-container> cscli bouncers add traefik-bouncer1.7 VictoriaMetrics 告警通知
创建 files/victoriametrics.yaml,将 CrowdSec 决策推送到 VictoriaMetrics:
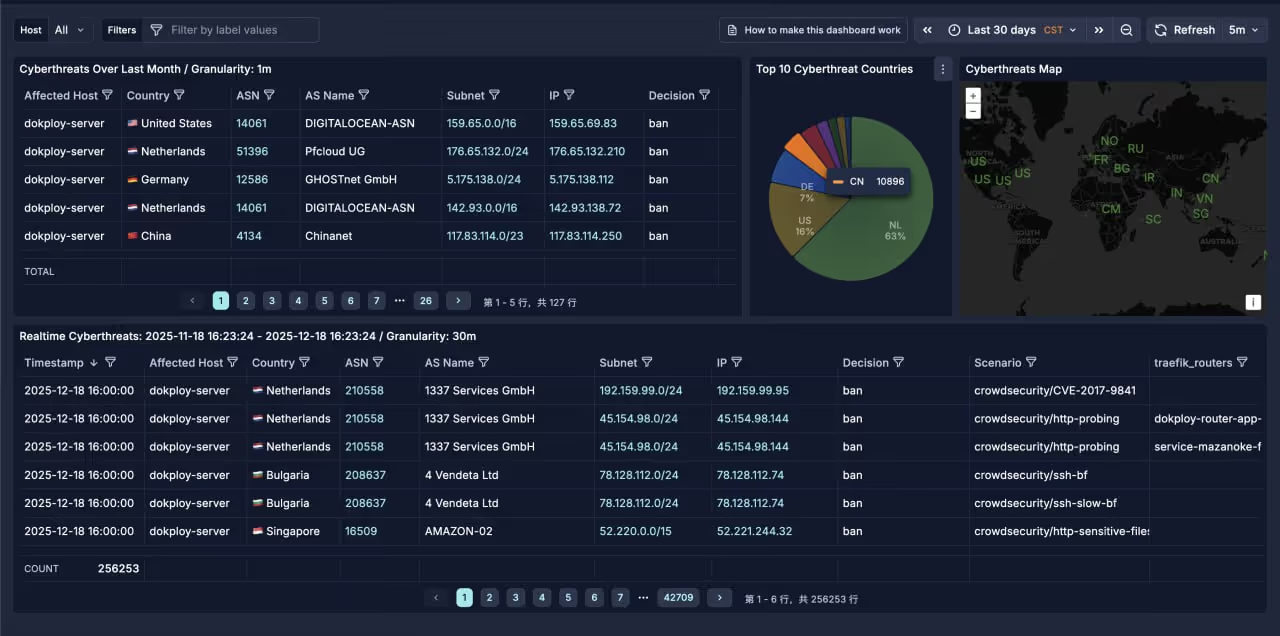
type: httpname: http_victoriametricslog_level: debugformat: > {{- range $Alert := . -}} {{- $traefikRouters := GetMeta . "traefik_router_name" -}} {{- range .Decisions -}} {"metric":{"__name__":"cs_lapi_decision","instance":"dokploy-server","country":"{{$Alert.Source.Cn}}","asname":"{{$Alert.Source.AsName}}","asnumber":"{{$Alert.Source.AsNumber}}","latitude":"{{$Alert.Source.Latitude}}","longitude":"{{$Alert.Source.Longitude}}","iprange":"{{$Alert.Source.Range}}","scenario":"{{.Scenario}}","type":"{{.Type}}","duration":"{{.Duration}}","scope":"{{.Scope}}","ip":"{{.Value}}","traefik_routers":{{ printf "%q" ($traefikRouters | uniq | join ",")}}},"values": [1],"timestamps":[{{now|unixEpoch}}000]} {{- end }} {{- end -}}url: http://service-victoriametrics-dhydty-victoriametrics-1:8428/api/v1/importmethod: POSTheaders: Content-Type: application/json这将创建 cs_lapi_decision 指标,包含攻击者的地理位置、ASN、场景等信息,便于在 Grafana 中分析。
第二部分:Traefik 与 Cloudflare 集成
2.1 为什么需要 Cloudflare IP 白名单
当使用 Cloudflare 作为 CDN 时,所有请求都经过 Cloudflare 代理。这带来两个问题:
- 来源 IP 混淆:Traefik 看到的客户端 IP 是 Cloudflare 的代理 IP,而非真实用户 IP
- 直连绕过:攻击者可能直接访问源站 IP,绕过 Cloudflare 的保护
解决方案:
- 配置
forwardedHeaders.trustedIPs信任 Cloudflare IP,正确获取真实客户端 IP - 配置
ipAllowList中间件,只允许 Cloudflare IP 访问
2.2 Traefik 静态配置
/etc/dokploy/traefik/traefik.yml 完整配置:
global: sendAnonymousUsage: false
experimental: plugins: bouncer: moduleName: github.com/maxlerebourg/crowdsec-bouncer-traefik-plugin version: v1.4.6
accessLog: filePath: "/etc/dokploy/traefik/dynamic/access.log" format: json bufferingSize: 100
providers: swarm: exposedByDefault: false watch: true docker: exposedByDefault: false watch: true file: directory: /etc/dokploy/traefik/dynamic watch: true
entryPoints: web: address: :80 forwardedHeaders: trustedIPs: # Cloudflare IPv4 - 173.245.48.0/20 - 103.21.244.0/22 - 103.22.200.0/22 - 103.31.4.0/22 - 141.101.64.0/18 - 108.162.192.0/18 - 190.93.240.0/20 - 188.114.96.0/20 - 197.234.240.0/22 - 198.41.128.0/17 - 162.158.0.0/15 - 104.16.0.0/13 - 104.24.0.0/14 - 172.64.0.0/13 - 131.0.72.0/22 http: middlewares: - cloudflare-only@file - crowdsec@file
websecure: address: :443 http3: advertisedPort: 443 forwardedHeaders: trustedIPs: # Cloudflare IPv4 (与 web 相同) - 173.245.48.0/20 - 103.21.244.0/22 - 103.22.200.0/22 - 103.31.4.0/22 - 141.101.64.0/18 - 108.162.192.0/18 - 190.93.240.0/20 - 188.114.96.0/20 - 197.234.240.0/22 - 198.41.128.0/17 - 162.158.0.0/15 - 104.16.0.0/13 - 104.24.0.0/14 - 172.64.0.0/13 - 131.0.72.0/22 http: middlewares: - cloudflare-only@file - crowdsec@file tls: certResolver: letsencrypt
api: insecure: true
certificatesResolvers: letsencrypt: acme: email: your-email@example.com storage: /etc/dokploy/traefik/dynamic/acme.json httpChallenge: entryPoint: web关键配置说明:
forwardedHeaders.trustedIPs: 信任 Cloudflare IP,使 Traefik 正确解析X-Forwarded-For头获取真实客户端 IPhttp.middlewares: 入口点级别的中间件链,所有请求都经过cloudflare-only和crowdsec中间件accessLog.format: json: JSON 格式日志便于 CrowdSec 和 Alloy 解析
2.3 动态中间件配置
/etc/dokploy/traefik/dynamic/middlewares.yml:
http: middlewares: redirect-to-https: redirectScheme: scheme: https permanent: true
cloudflare-only: ipAllowList: sourceRange: # Cloudflare IPv4 - "173.245.48.0/20" - "103.21.244.0/22" - "103.22.200.0/22" - "103.31.4.0/22" - "141.101.64.0/18" - "108.162.192.0/18" - "190.93.240.0/20" - "188.114.96.0/20" - "197.234.240.0/22" - "198.41.128.0/17" - "162.158.0.0/15" - "104.16.0.0/13" - "104.24.0.0/14" - "172.64.0.0/13" - "131.0.72.0/22" # Cloudflare IPv6 - "2400:cb00::/32" - "2606:4700::/32" - "2803:f800::/32" - "2405:b500::/32" - "2405:8100::/32" - "2a06:98c0::/29" - "2c0f:f248::/32"
crowdsec: plugin: bouncer: enabled: true crowdsecMode: live crowdsecLapiKey: YOUR_TRAEFIK_BOUNCER_KEY crowdsecLapiHost: service-crowdsec-k5ws6c-crowdsec-1:8080TIPCloudflare IP 列表可能会更新,建议定期从 https://www.cloudflare.com/ips/ 获取最新列表。
2.4 真实 IP 识别机制
请求流经以下路径时,IP 信息的变化:
用户 (203.0.113.50) → Cloudflare (添加 CF-Connecting-IP: 203.0.113.50) → Traefik (信任 Cloudflare IP,解析 X-Forwarded-For) → CrowdSec (从日志获取真实 IP 203.0.113.50)Traefik 访问日志示例:
{ "ClientAddr": "172.71.99.180:11150", "ClientHost": "203.0.113.50", "RequestHost": "example.com", "RequestMethod": "GET", "RequestPath": "/api/data", "DownstreamStatus": 200, "RouterName": "my-router@docker"}ClientAddr: Cloudflare 代理 IPClientHost: 真实客户端 IP(通过信任配置正确解析)
2.5 特殊路由旁路配置
某些服务可能需要绕过 CrowdSec 检测(如分析服务)。可以创建单独的路由配置:
http: routers: rybbit-backend-websecure: rule: Host(`analytics.example.com`) && PathPrefix(`/api`) service: rybbit-backend-service entryPoints: - websecure tls: certResolver: letsencrypt priority: 100 # 高优先级确保先匹配
services: rybbit-backend-service: loadBalancer: servers: - url: http://rybbit-backend:3001 passHostHeader: true注意:这些路由没有应用 crowdsec@file 中间件,因此不受 CrowdSec 保护。
第三部分:监控日志体系
3.1 Loki 日志存储
Loki 是 Grafana Labs 开发的日志聚合系统,专为 Kubernetes 和容器环境设计。
files/loki-config.yaml 配置:
# Loki 3.x 配置 - 优化存储auth_enabled: false
server: http_listen_port: 3100 grpc_listen_port: 9096 log_level: info
common: path_prefix: /loki storage: filesystem: chunks_directory: /loki/chunks rules_directory: /loki/rules replication_factor: 1 ring: kvstore: store: inmemory
# Loki 3.x 使用 TSDB + v13 schemaschema_config: configs: - from: 2024-01-01 store: tsdb object_store: filesystem schema: v13 index: prefix: index_ period: 24h
storage_config: tsdb_shipper: active_index_directory: /loki/tsdb-shipper-active cache_location: /loki/tsdb-shipper-cache cache_ttl: 24h filesystem: directory: /loki/chunks
# Ingester 优化,提高压缩率ingester: chunk_idle_period: 30m chunk_block_size: 262144 # 256KB blocks chunk_target_size: 1572864 # 1.5MB chunks chunk_retain_period: 1m max_chunk_age: 2h flush_check_period: 30s flush_op_timeout: 10m wal: enabled: true dir: /loki/wal flush_on_shutdown: true
limits_config: retention_period: 336h # 14 天保留 ingestion_rate_mb: 8 ingestion_burst_size_mb: 16 max_streams_per_user: 5000 max_entries_limit_per_query: 5000 max_line_size: 128KB allow_structured_metadata: true per_stream_rate_limit: 3MB per_stream_rate_limit_burst: 10MB max_label_name_length: 1024 max_label_value_length: 2048 max_label_names_per_series: 15
compactor: working_directory: /loki/compactor retention_enabled: true retention_delete_delay: 1h delete_request_store: filesystem compaction_interval: 10m retention_delete_worker_count: 150
query_range: results_cache: cache: embedded_cache: enabled: true max_size_mb: 100 parallelise_shardable_queries: true cache_results: true
query_scheduler: max_outstanding_requests_per_tenant: 100
analytics: reporting_enabled: false3.2 Alloy 日志采集
Grafana Alloy 是新一代日志/指标采集器,取代 Promtail。
files/alloy-config.alloy 配置:
// Grafana Alloy 配置 - 日志采集// 优化存储效率
// ============================================// Loki 输出端点// ============================================loki.write "default" { endpoint { url = "http://loki:3100/loki/api/v1/push" batch_wait = "5s" // 批量发送,提高压缩率 batch_size = "1MiB" // 1MB 批量大小 } external_labels = { cluster = "dokploy", }}
// ============================================// Docker 容器发现// ============================================discovery.docker "containers" { host = "unix:///var/run/docker.sock" refresh_interval = "30s"}
// ============================================// Docker 容器日志采集// ============================================discovery.relabel "docker_logs" { targets = discovery.docker.containers.targets
// 提取容器名称 rule { source_labels = ["__meta_docker_container_name"] regex = "/(.*)" target_label = "container" }
// 提取 compose 项目 rule { source_labels = ["__meta_docker_container_label_com_docker_compose_project"] target_label = "compose_project" }
// 提取 compose 服务 rule { source_labels = ["__meta_docker_container_label_com_docker_compose_service"] target_label = "compose_service" }
// 提取镜像名 rule { source_labels = ["__meta_docker_container_image"] target_label = "image" }}
loki.source.docker "containers" { host = "unix:///var/run/docker.sock" targets = discovery.relabel.docker_logs.output forward_to = [loki.process.docker.receiver]}
loki.process "docker" { stage.static_labels { values = { job = "docker", host = "dokploy-server", } }
forward_to = [loki.write.default.receiver]}
// ============================================// Traefik 访问日志 (JSON 格式)// ============================================local.file_match "traefik" { path_targets = [{"__path__" = "/var/log/traefik/access.log"}] sync_period = "15s"}
loki.source.file "traefik" { targets = local.file_match.traefik.targets forward_to = [loki.process.traefik.receiver] tail_from_end = true}
loki.process "traefik" { stage.static_labels { values = { job = "traefik", host = "dokploy-server", } }
// 解析 JSON 并提取字段作为标签 stage.json { expressions = { client_ip = "ClientHost", method = "RequestMethod", path = "RequestPath", status = "DownstreamStatus", router = "RouterName", request_host = "RequestHost", entry_point = "entryPointName", } }
stage.labels { values = { client_ip = "", method = "", status = "", router = "", request_host = "", entry_point = "", } }
forward_to = [loki.write.default.receiver]}
// ============================================// SSH/Auth 日志// ============================================local.file_match "auth" { path_targets = [{"__path__" = "/var/log/host/auth.log"}] sync_period = "30s"}
loki.source.file "auth" { targets = local.file_match.auth.targets forward_to = [loki.process.auth.receiver] tail_from_end = true}
loki.process "auth" { stage.static_labels { values = { job = "auth", host = "dokploy-server", } }
// 解析 syslog 格式 stage.regex { expression = "^(?P<timestamp>\\w+\\s+\\d+\\s+\\d+:\\d+:\\d+)\\s+(?P<hostname>\\S+)\\s+(?P<service>[^\\[:]+)(?:\\[(?P<pid>\\d+)\\])?:\\s+(?P<message>.*)$" }
stage.labels { values = { service = "", } }
forward_to = [loki.write.default.receiver]}
// ============================================// UFW 防火墙日志// ============================================local.file_match "ufw" { path_targets = [{"__path__" = "/var/log/host/ufw.log"}] sync_period = "30s"}
loki.source.file "ufw" { targets = local.file_match.ufw.targets forward_to = [loki.process.ufw.receiver] tail_from_end = true}
loki.process "ufw" { stage.static_labels { values = { job = "ufw", host = "dokploy-server", } }
// 提取 UFW 字段 stage.regex { expression = "\\[UFW (?P<action>\\w+)\\].*SRC=(?P<src_ip>[\\d\\.a-fA-F:]+).*PROTO=(?P<proto>\\w+)" }
stage.regex { expression = "DPT=(?P<dst_port>\\d+)" }
stage.labels { values = { action = "", src_ip = "", proto = "", dst_port = "", } }
forward_to = [loki.write.default.receiver]}
// ============================================// 内核日志// ============================================local.file_match "kernel" { path_targets = [{"__path__" = "/var/log/host/kern.log"}] sync_period = "30s"}
loki.source.file "kernel" { targets = local.file_match.kernel.targets forward_to = [loki.process.kernel.receiver] tail_from_end = true}
loki.process "kernel" { stage.static_labels { values = { job = "kernel", host = "dokploy-server", } }
forward_to = [loki.write.default.receiver]}
// ============================================// CrowdSec 日志// ============================================local.file_match "crowdsec" { path_targets = [ {"__path__" = "/var/log/crowdsec/crowdsec.log", "log_type" = "main"}, {"__path__" = "/var/log/crowdsec/crowdsec_api.log", "log_type" = "api"}, {"__path__" = "/var/log/crowdsec/firewall-bouncer.log", "log_type" = "firewall-bouncer"}, ] sync_period = "30s"}
loki.source.file "crowdsec" { targets = local.file_match.crowdsec.targets forward_to = [loki.process.crowdsec.receiver] tail_from_end = true}
loki.process "crowdsec" { stage.static_labels { values = { job = "crowdsec", host = "dokploy-server", } }
forward_to = [loki.write.default.receiver]}3.3 VictoriaMetrics 指标存储
VictoriaMetrics 是高性能的 Prometheus 兼容时间序列数据库。
docker-compose.yml:
version: "3.8"services: victoriametrics: image: victoriametrics/victoria-metrics:latest restart: unless-stopped volumes: - vm-data:/storage - ../files/scrape.yml:/etc/victoriametrics/scrape.yml - ../files/blackbox:/etc/prometheus/blackbox ports: - "127.0.0.1:20001:8428" command: - "--storageDataPath=/storage" - "--retentionPeriod=90d" - "--httpListenAddr=:8428" - "--promscrape.config=/etc/victoriametrics/scrape.yml" networks: - default - dokploy-network
networks: default: dokploy-network: external: true
volumes: vm-data:files/scrape.yml 指标采集配置:
scrape_configs: - job_name: 'crowdsec' scrape_interval: 15s static_configs: - targets: ['service-crowdsec-k5ws6c-crowdsec-1:6060']
- job_name: 'logporter' scrape_interval: 15s static_configs: - targets: ['service-loki-wykkft-logporter-1:9333'] metric_relabel_configs: - source_labels: [__name__] regex: 'docker_.*' action: keep
- job_name: 'node-exporter' scrape_interval: 15s static_configs: - targets: ['service-loki-wykkft-node_exporter-1:9100']3.4 完整 Docker Compose 配置
Loki + Alloy + Node Exporter + Logporter 的完整配置:
version: "3.8"
services: loki: image: grafana/loki:latest restart: unless-stopped command: -config.file=/etc/loki/local-config.yaml volumes: - loki-data:/loki - ../files/loki-config.yaml:/etc/loki/local-config.yaml networks: - default - dokploy-network
alloy: image: grafana/alloy:latest restart: unless-stopped command: - run - /etc/alloy/config.alloy - --server.http.listen-addr=0.0.0.0:12345 - --storage.path=/var/lib/alloy/data volumes: - ../files/alloy-config.alloy:/etc/alloy/config.alloy - alloy-data:/var/lib/alloy/data - /var/run/docker.sock:/var/run/docker.sock:ro # Traefik 日志 - /etc/dokploy/traefik/dynamic/access.log:/var/log/traefik/access.log:ro # 系统日志 - /var/log/auth.log:/var/log/host/auth.log:ro - /var/log/ufw.log:/var/log/host/ufw.log:ro - /var/log/kern.log:/var/log/host/kern.log:ro # CrowdSec 日志 - /var/log/crowdsec.log:/var/log/crowdsec/crowdsec.log:ro - /var/log/crowdsec_api.log:/var/log/crowdsec/crowdsec_api.log:ro - /var/log/crowdsec-firewall-bouncer.log:/var/log/crowdsec/firewall-bouncer.log:ro depends_on: - loki networks: - default - dokploy-network
logporter: image: lifailon/logporter:latest restart: unless-stopped environment: - DOCKER_LOG_METRICS=false - DOCKER_LOG_CUSTOM_METRICS=false - DOCKER_LOG_CUSTOM_QUERY=error|Error|ERROR|exception|Exception|EXCEPTION|fail|Fail|FAIL volumes: - /var/run/docker.sock:/var/run/docker.sock networks: - default - dokploy-network
node_exporter: image: quay.io/prometheus/node-exporter:latest restart: unless-stopped command: - '--path.rootfs=/host' - '--path.procfs=/host/proc' - '--path.sysfs=/host/sys' - '--collector.filesystem.mount-points-exclude=^/(sys|proc|dev|host|etc)($$|/)' volumes: - /proc:/host/proc:ro - /sys:/host/sys:ro - /:/host:ro,rslave pid: host networks: - default - dokploy-network
networks: default: dokploy-network: external: true
volumes: loki-data: alloy-data:3.5 Grafana 部署
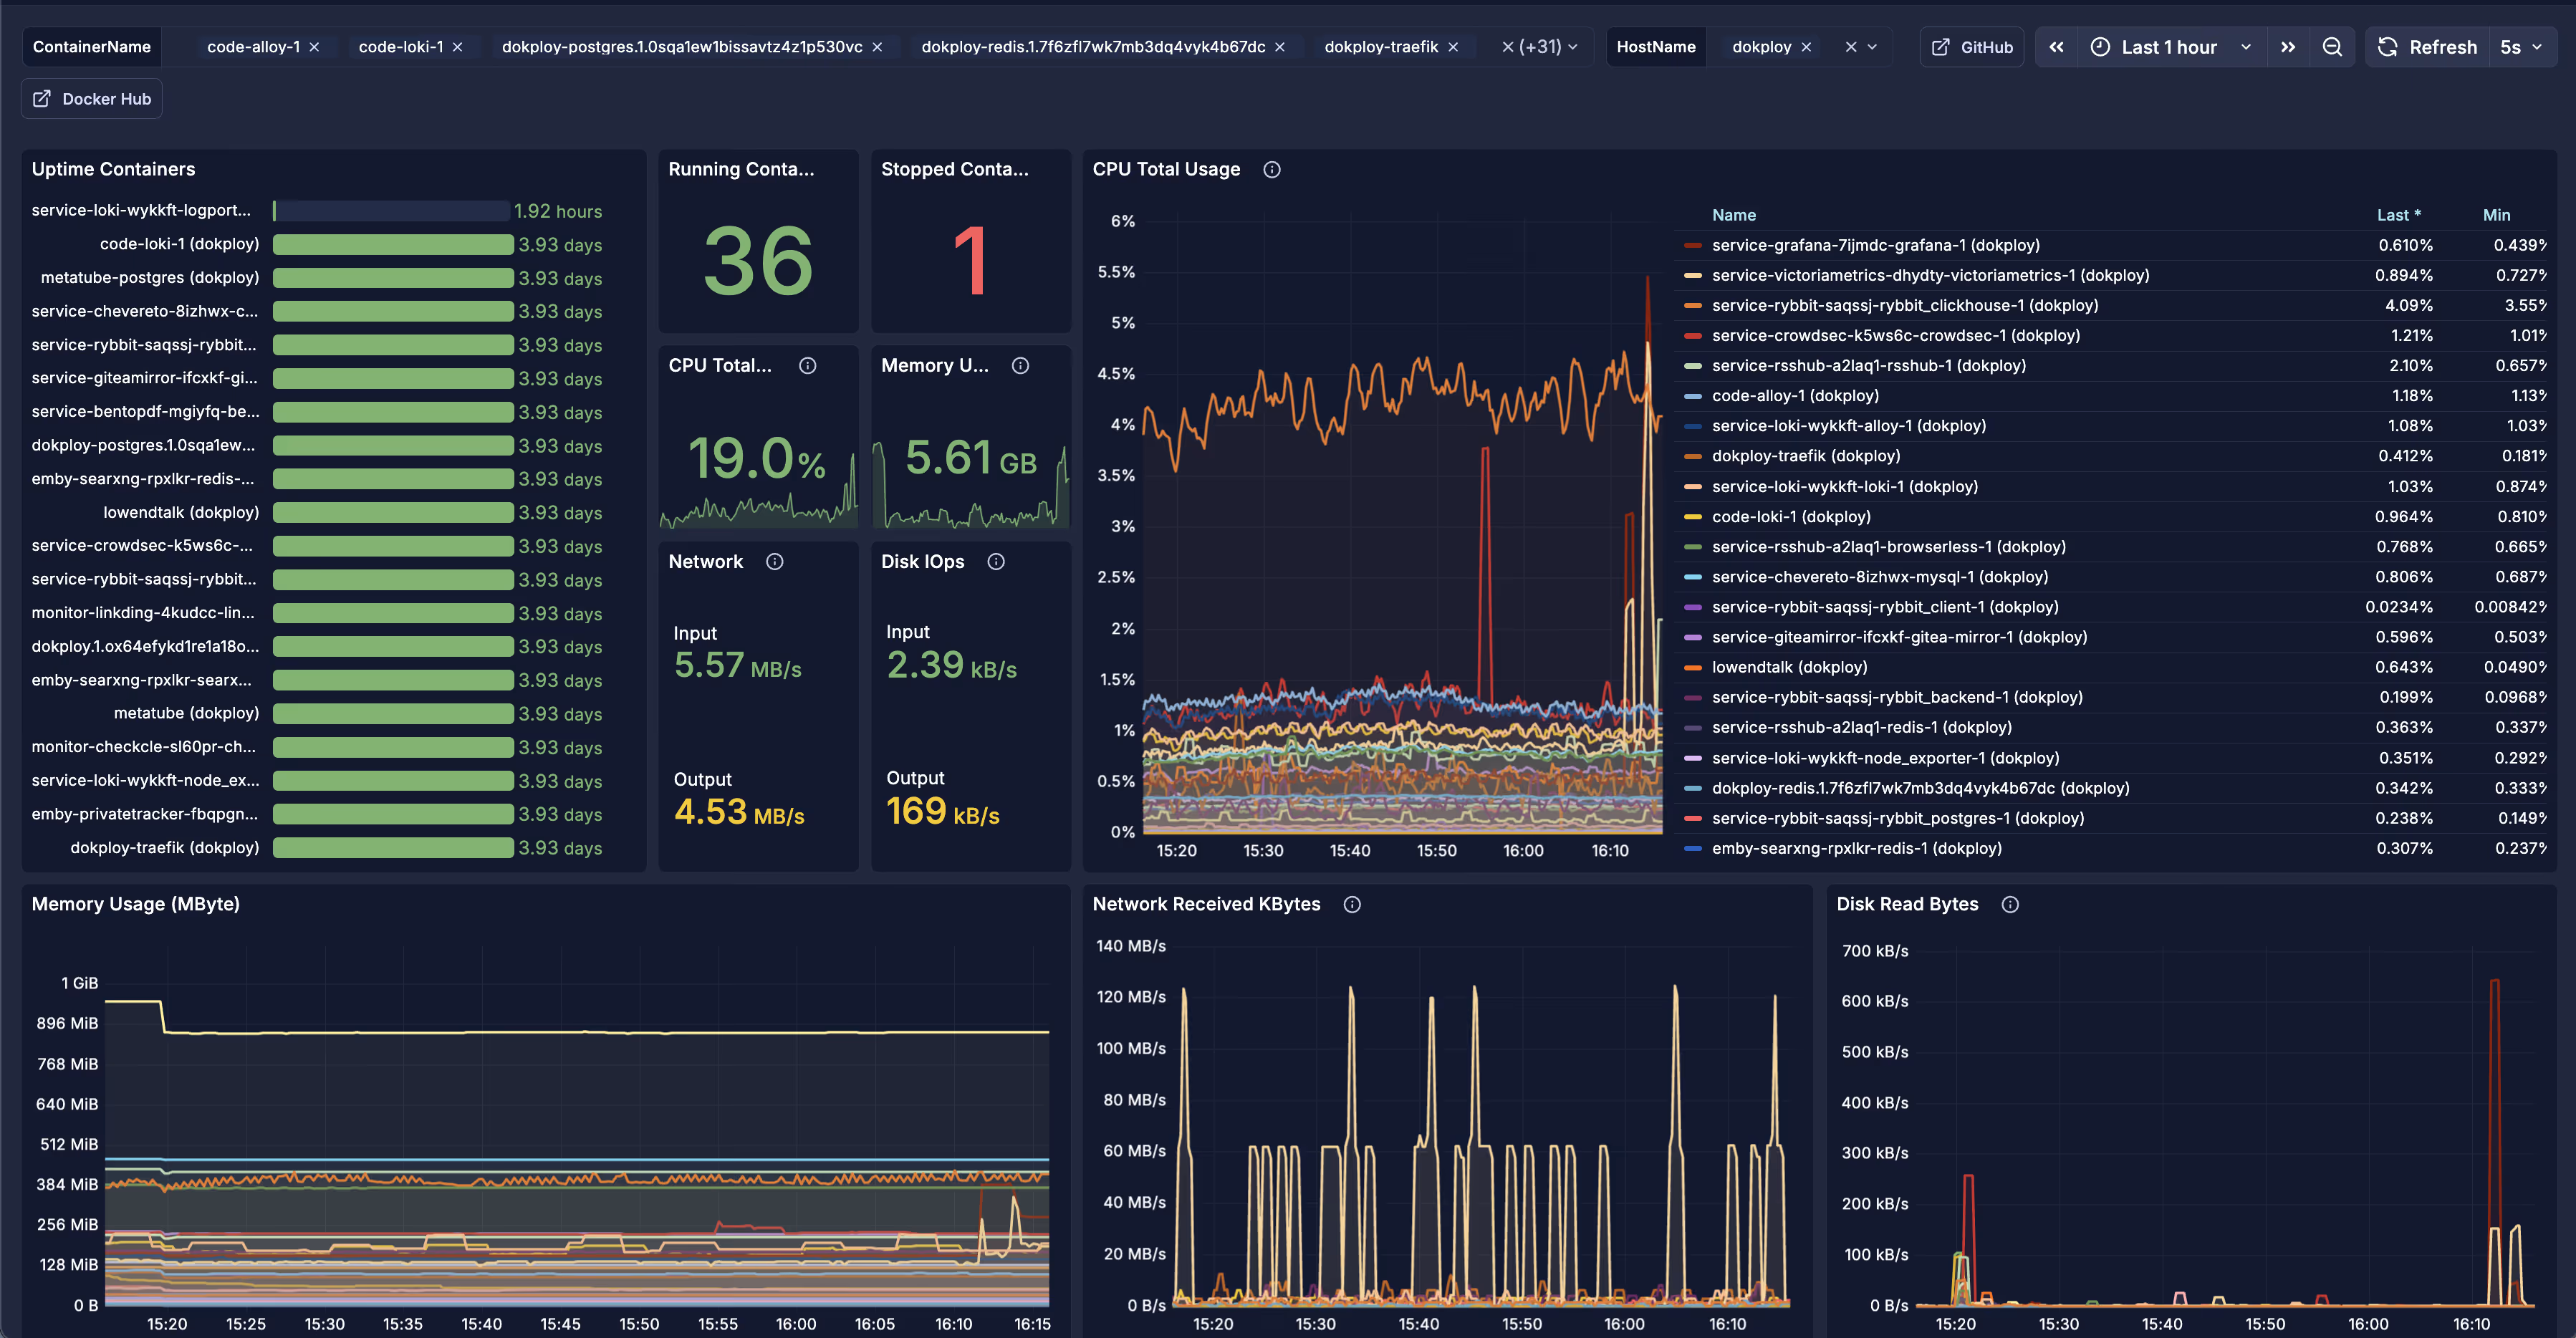
Grafana 用于统一可视化所有监控数据:
version: "3.8"services: grafana: image: grafana/grafana:latest restart: unless-stopped volumes: - grafana-storage:/var/lib/grafana ports: - "127.0.0.1:20000:3000" networks: - default - dokploy-network
networks: default: dokploy-network: external: true
volumes: grafana-storage:配置数据源:
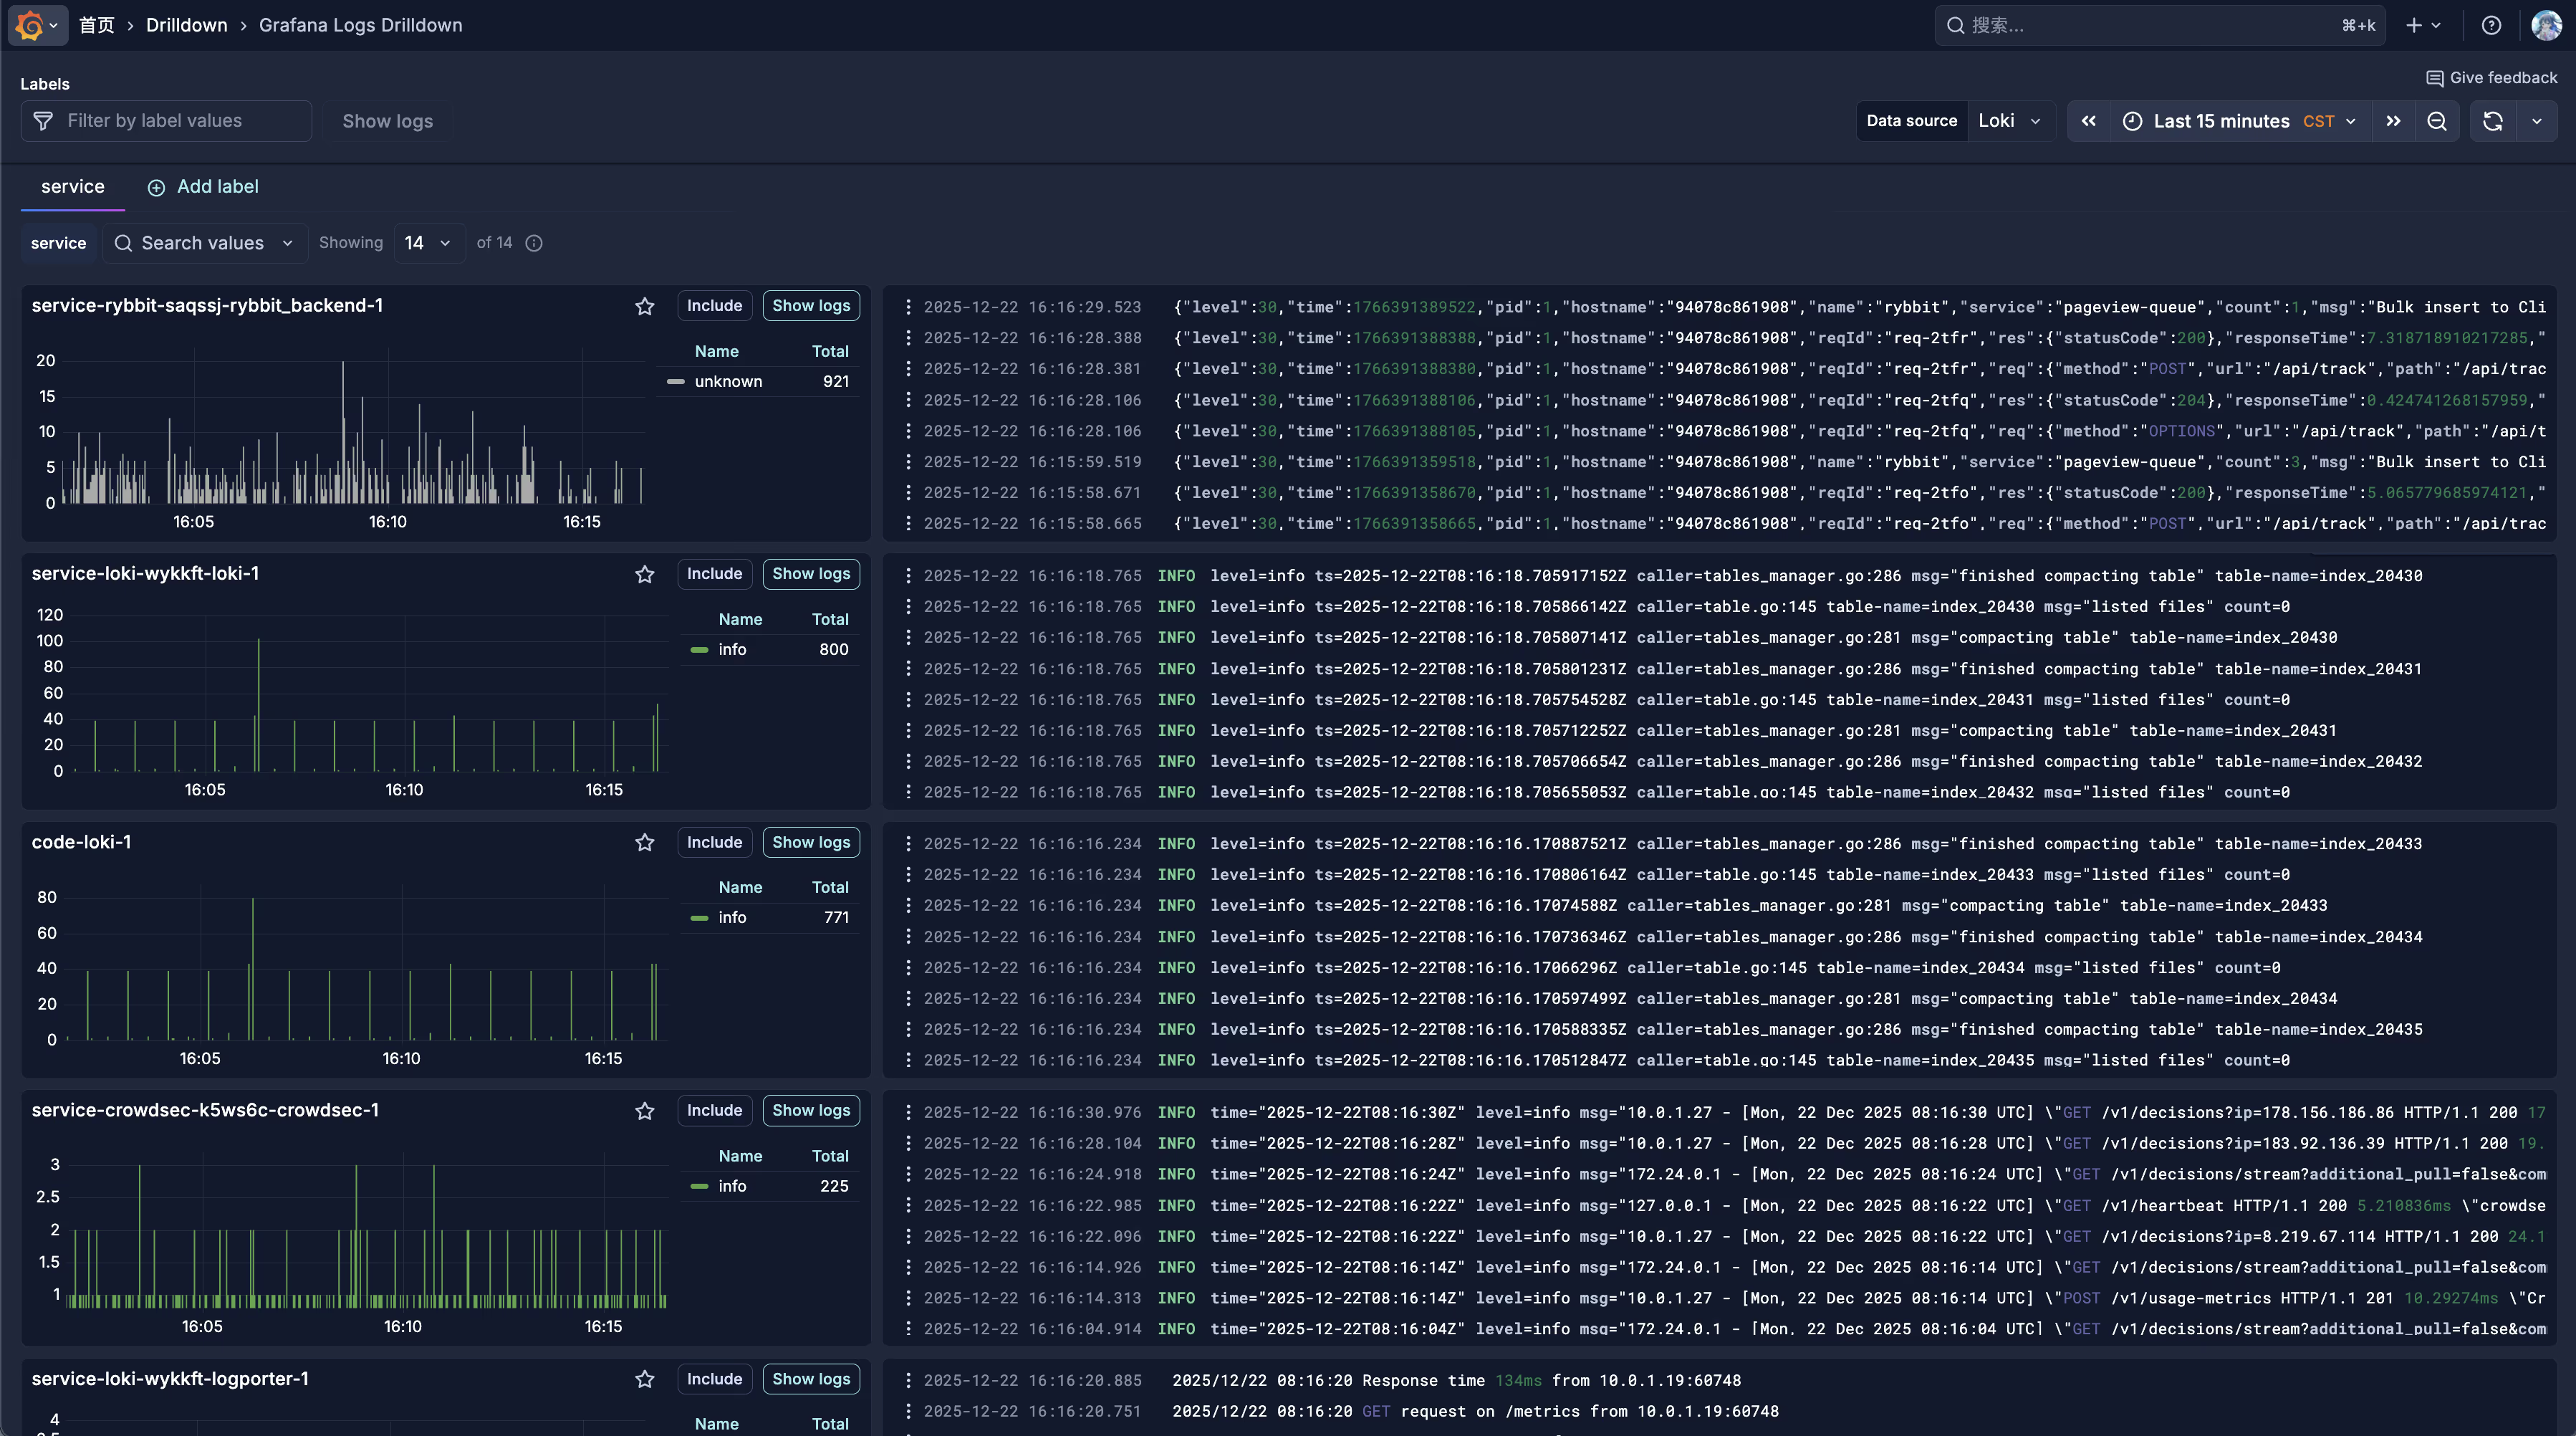
- Loki: URL 设置为
http://service-loki-wykkft-loki-1:3100 - VictoriaMetrics: URL 设置为
http://service-victoriametrics-dhydty-victoriametrics-1:8428
接入面板
第四部分:故障排查
4.1 CrowdSec 常见问题
问题:Bouncer 连接失败
# 检查 CrowdSec 服务状态docker exec -it <crowdsec-container> cscli bouncers list
# 检查 LAPI 连接curl -s http://127.0.0.1:8080/v1/decisions | head问题:没有检测到攻击
# 检查日志采集状态docker exec -it <crowdsec-container> cscli metrics
# 检查场景状态docker exec -it <crowdsec-container> cscli scenarios list问题:误封正常用户
# 查看当前封禁列表docker exec -it <crowdsec-container> cscli decisions list
# 解除特定 IP 封禁docker exec -it <crowdsec-container> cscli decisions delete --ip <IP>
# 添加白名单docker exec -it <crowdsec-container> cscli parsers install crowdsecurity/whitelists4.2 Traefik 连接问题
问题:503 Service Unavailable
# 检查容器网络docker network inspect dokploy-network
# 检查服务是否在正确网络中docker inspect <container> | grep -A 10 Networks问题:真实 IP 获取错误
检查 traefik.yml 中的 forwardedHeaders.trustedIPs 是否包含所有 Cloudflare IP。
4.3 日志采集问题
问题:Loki 中没有日志
# 检查 Alloy 状态docker logs <alloy-container> --tail 100
# 检查 Loki 健康状态curl -s http://127.0.0.1:3100/ready问题:日志标签缺失
检查 Alloy 配置中的 stage.labels 和 stage.json 配置是否正确。
4.4 监控数据缺失
问题:VictoriaMetrics 无数据
# 检查抓取目标状态curl -s http://127.0.0.1:20001/targets
# 手动查询指标curl -s "http://127.0.0.1:20001/api/v1/query?query=up"问题:CrowdSec 指标推送失败
检查 victoriametrics.yaml 中的 URL 是否正确,确保容器名称与实际一致。
总结
本文详细介绍了在 Dokploy 环境中构建完整安全与监控体系的过程:
- CrowdSec 多层防护:容器化部署 + 主机 Firewall Bouncer + Traefik 插件
- Traefik + Cloudflare 集成:IP 白名单 + 真实 IP 识别
- 可观测性平台:Loki 日志 + VictoriaMetrics 指标 + Grafana 可视化
- 全面日志采集:Docker 容器、系统日志、Traefik 访问日志、安全日志
这套体系提供了从网络层到应用层的完整防护,以及全面的可观测性支持,适合生产环境使用。
参考资料: