Aeza AMD EPYC 8534P Storage VPS Benchmark
Aeza AMD EPYC 8534P Storage VPS Benchmark
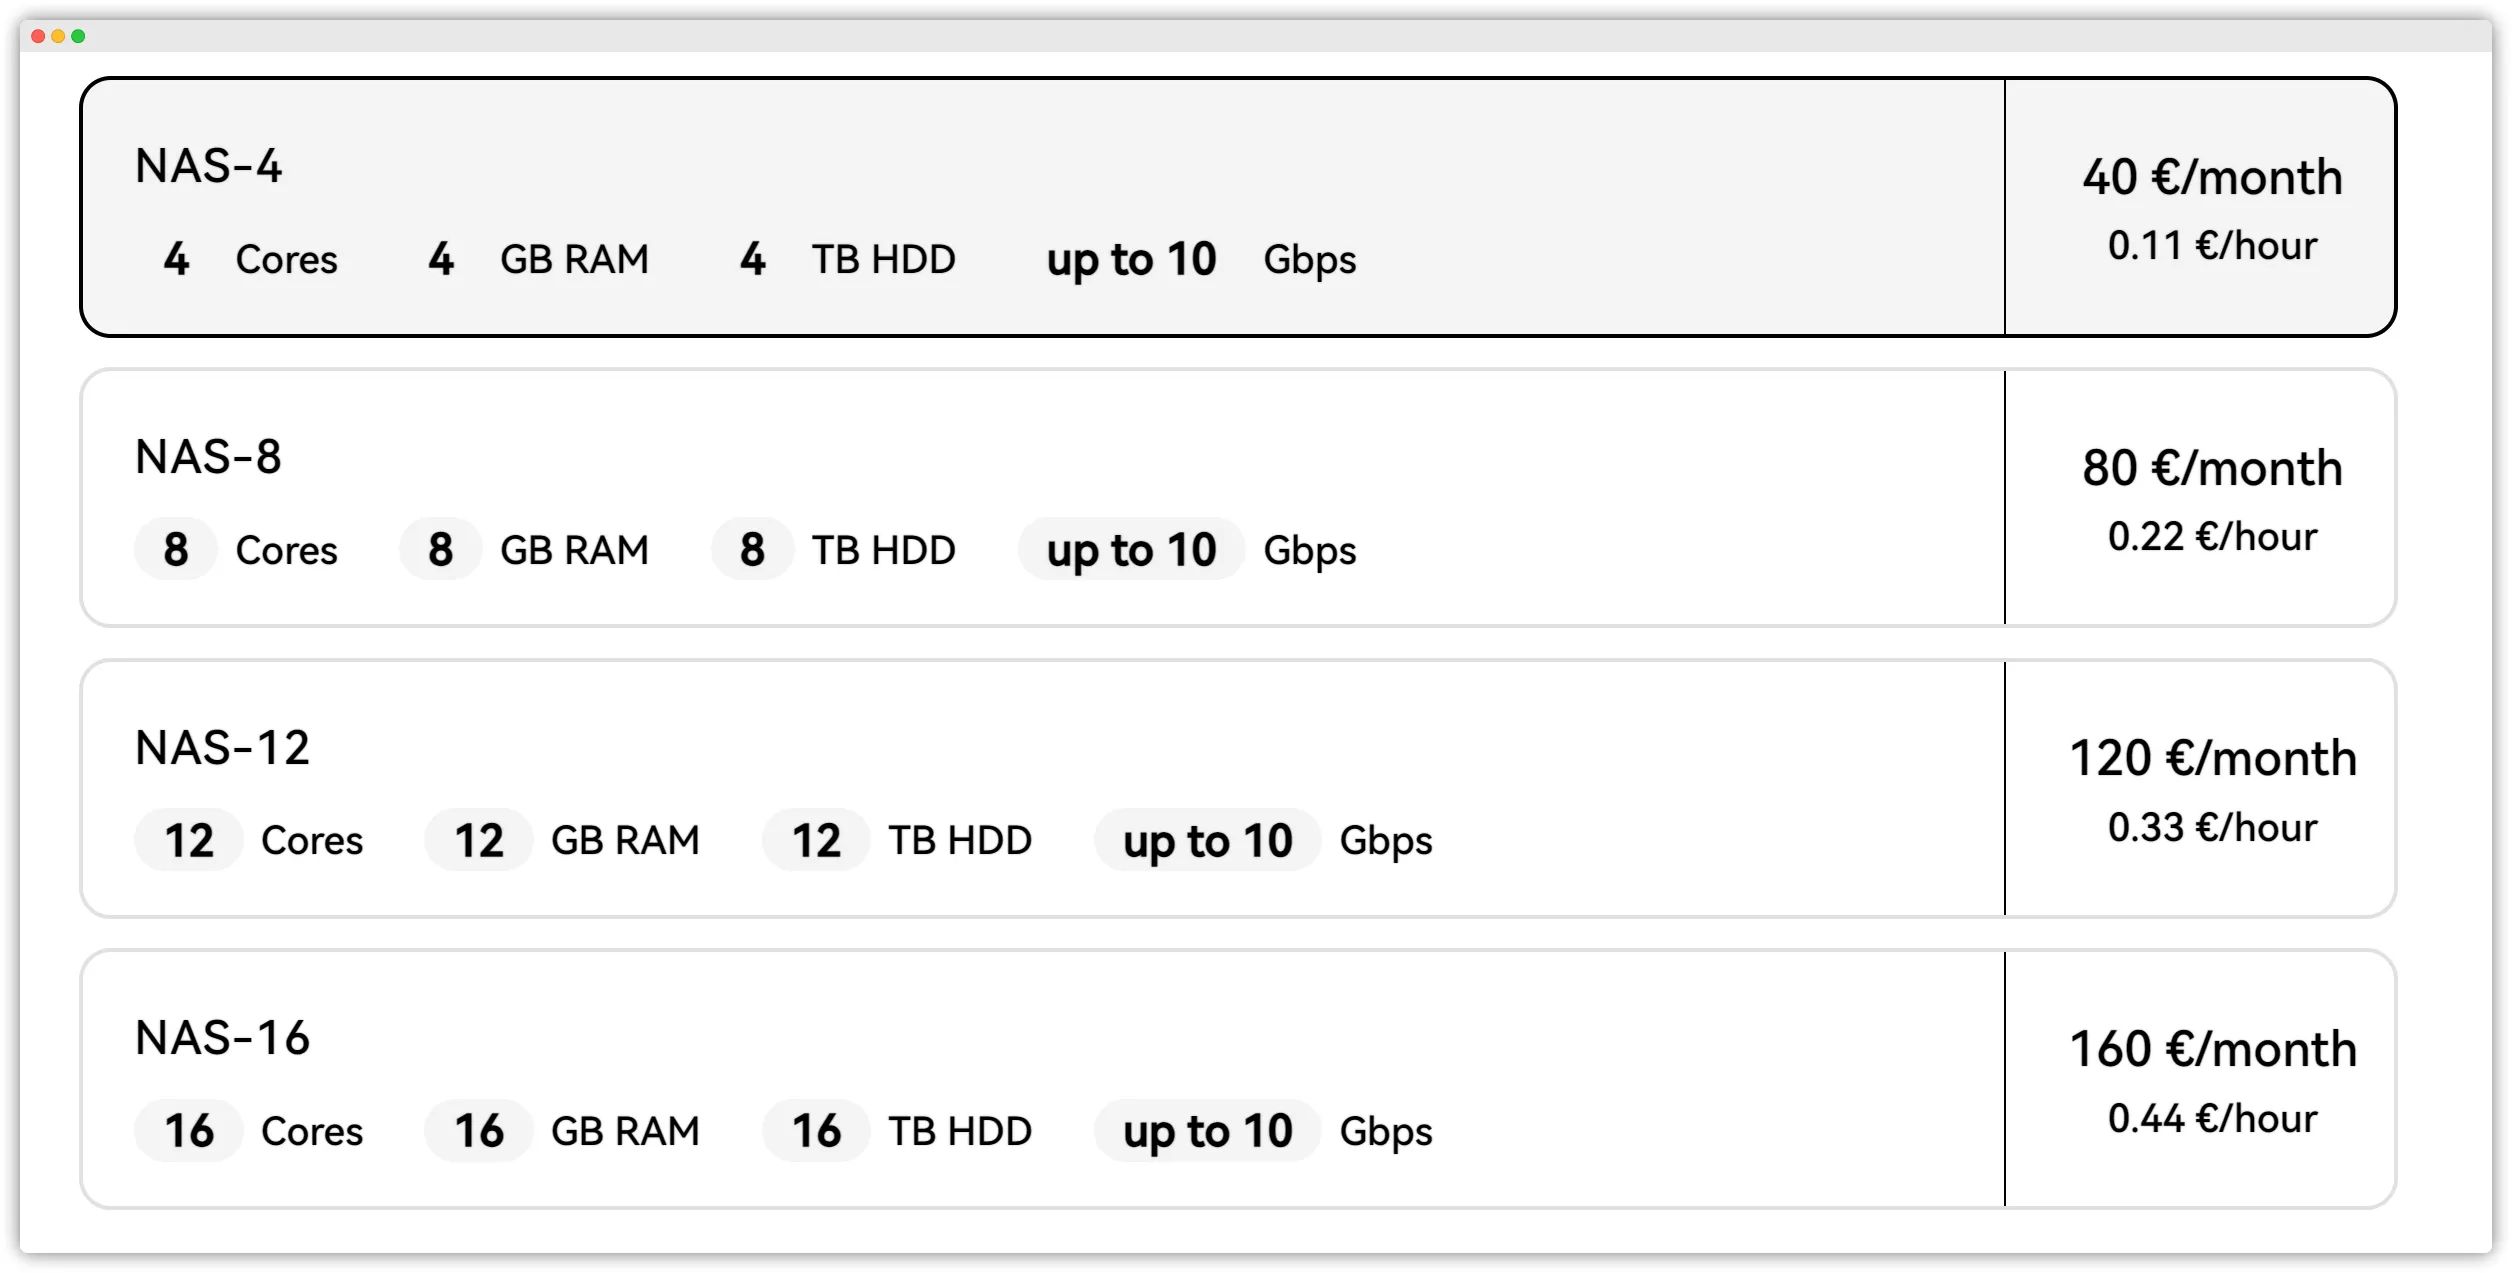
Russian provider Aeza has rolled out a new storage product line today, and it’s pricey. The VPS uses an AMD EPYC 8534P CPU with a ZFS RAID storage array and time-based bandwidth throttling. Current plans start at 4c/4G/4T for USD $40 per month. At this price point, not including an NVMe disk as the system drive is really hard to justify, and the overall price‑performance ratio is quite poor.
- From 14<00> to 01<00> Beijing time, the speed can reach 10 Gbps.
- From 01<00> to 14<00> Beijing time, the speed is capped at 1 Gbps.
Benchmark
CPU
root@catcat:~# lscpuArchitecture: x86_64 CPU op-mode(s): 32-bit, 64-bit Address sizes: 48 bits physical, 57 bits virtual Byte Order: Little EndianCPU(s): 4 On-line CPU(s) list: 0-3Vendor ID: AuthenticAMD BIOS Vendor ID: Red Hat Model name: AMD EPYC 8534P 64-Core Processor BIOS Model name: RHEL 7.6.0 PC (i440FX + PIIX, 1996) CPU @ 2.0GHz BIOS CPU family: 1 CPU family: 25 Model: 160 Thread(s) per core: 1 Core(s) per socket: 4 Socket(s): 1 Stepping: 2 BogoMIPS: 4593.09 Flags: fpu vme de pse tsc msr pae mce cx8 apic sep mtrr pge mca cmov pat pse36 clflus h mmx fxsr sse sse2 ht syscall nx mmxext fxsr_opt pdpe1gb rdtscp lm rep_good n opl cpuid extd_apicid tsc_known_freq pni pclmulqdq ssse3 fma cx16 pcid sse4_1 sse4_2 x2apic movbe popcnt tsc_deadline_timer aes xsave avx f16c rdrand hyperv isor lahf_lm cmp_legacy svm cr8_legacy abm sse4a misalignsse 3dnowprefetch osv w perfctr_core invpcid_single ssbd ibrs ibpb stibp vmmcall fsgsbase tsc_adjust bmi1 avx2 smep bmi2 erms invpcid avx512f avx512dq rdseed adx smap avx512ifma clflushopt clwb avx512cd sha_ni avx512bw avx512vl xsaveopt xsavec xgetbv1 xsav es avx512_bf16 clzero xsaveerptr wbnoinvd arat npt lbrv nrip_save tsc_scale vm cb_clean flushbyasid pausefilter pfthreshold v_vmsave_vmload vgif avx512vbmi u mip pku ospke avx512_vbmi2 gfni vaes vpclmulqdq avx512_vnni avx512_bitalg avx5 12_vpopcntdq la57 rdpid fsrm flush_l1d arch_capabilitiesVirtualization features: Virtualization: AMD-V Hypervisor vendor: KVM Virtualization type: fullCaches (sum of all): L1d: 256 KiB (4 instances) L1i: 256 KiB (4 instances) L2: 2 MiB (4 instances) L3: 64 MiB (4 instances)NUMA: NUMA node(s): 1 NUMA node0 CPU(s): 0-3Vulnerabilities: Gather data sampling: Not affected Itlb multihit: Not affected L1tf: Not affected Mds: Not affected Meltdown: Not affected Mmio stale data: Not affected Reg file data sampling: Not affected Retbleed: Not affected Spec rstack overflow: Mitigation; safe RET Spec store bypass: Mitigation; Speculative Store Bypass disabled via prctl Spectre v1: Mitigation; usercopy/swapgs barriers and __user pointer sanitization Spectre v2: Mitigation; Retpolines; IBPB conditional; IBRS_FW; STIBP disabled; RSB filling ; PBRSB-eIBRS Not affected; BHI Not affected Srbds: Not affected Tsx async abort: Not affectedYabs
Basic System Information:---------------------------------Uptime : 0 days, 0 hours, 0 minutesProcessor : AMD EPYC 8534P 64-Core ProcessorCPU cores : 4 @ 2296.548 MHzAES-NI : ✔️ EnabledVM-x/AMD-V : ✔️ EnabledRAM : 3.8 GiBSwap : 512.0 MiBDisk : 3.9 TiBDistro : Debian GNU/Linux 12 (bookworm)Kernel : 6.1.0-22-amd64VM Type : KVMIPv4/IPv6 : ✔️ Online / ❌ Offline
IPv4 Network Information:---------------------------------ISP : Aeza International LTDASN : AS210644 AEZA INTERNATIONAL LTDHost : Aeza International LTDLocation : London, England (ENG)Country : United Kingdom
fio Disk Speed Tests (Mixed R/W 50/50) (Partition /dev/vda2):---------------------------------Block Size | 4k (IOPS) | 64k (IOPS) ------ | --- ---- | ---- ----Read | 3.93 MB/s (984) | 58.09 MB/s (907)Write | 3.96 MB/s (990) | 58.66 MB/s (916)Total | 7.89 MB/s (1.9k) | 116.75 MB/s (1.8k) | |Block Size | 512k (IOPS) | 1m (IOPS) ------ | --- ---- | ---- ----Read | 410.54 MB/s (801) | 512.77 MB/s (500)Write | 432.36 MB/s (844) | 546.92 MB/s (534)Total | 842.90 MB/s (1.6k) | 1.05 GB/s (1.0k)
iperf3 Network Speed Tests (IPv4):---------------------------------Provider | Location (Link) | Send Speed | Recv Speed | Ping----- | ----- | ---- | ---- | ----Clouvider | London, UK (10G) | 8.97 Gbits/sec | 6.98 Gbits/sec | 6.10 msEranium | Amsterdam, NL (100G) | busy | busy | --Uztelecom | Tashkent, UZ (10G) | 1.64 Gbits/sec | 1.90 Gbits/sec | 95.9 msLeaseweb | Singapore, SG (10G) | 805 Mbits/sec | 987 Mbits/sec | 178 msClouvider | Los Angeles, CA, US (10G) | busy | 2.60 Mbits/sec | --Leaseweb | NYC, NY, US (10G) | 2.11 Gbits/sec | 2.45 Gbits/sec | 74.6 msEdgoo | Sao Paulo, BR (1G) | 880 Mbits/sec | 1.08 Gbits/sec | 165 ms
Geekbench 6 BenchMark Test:---------------------------------Test | Value |Single Core | 1736Multi Core | 5514Full Test | https://browser.geekbench.com/v6/cpu/6834382
YABS completed in 11 min 58 secGeekBench5
Geekbench 5 测试结果
系统信息 Operating System Debian GNU/Linux 12 (bookworm) Kernel Linux 6.1.0-22-amd64 x86_64 Model Red Hat KVM Motherboard N/A BIOS SeaBIOS 1.16.0-4.module_el8.9.0+3659+9c8643f3
处理器信息 Name AMD EPYC 8534P 64-Core Processor Topology 1 Processor, 4 Cores Identifier AuthenticAMD Family 25 Model 160 Stepping 2 Base Frequency 2.30 GHz L1 Instruction Cache 64.0 KB x 4 L1 Data Cache 64.0 KB x 4 L2 Cache 512 KB x 4 L3 Cache 16.0 MB
内存信息 Size 3.82 GB
单核测试分数:1210多核测试分数:4356详细结果链接:https://browser.geekbench.com/v5/cpu/22666764可供参考链接:https://browser.geekbench.com/search?k=v5_cpu&q=AMD%20EPYC%208534PBench
---------------------------------------------------------------------- CPU Model : AMD EPYC 8534P 64-Core Processor CPU Cores : 4 @ 2296.548 MHz CPU Cache : 512 KB AES-NI : ✓ Enabled VM-x/AMD-V : ✓ Enabled Total Disk : 3.9 TB (3.7 GB Used) Total Mem : 3.8 GB (318.6 MB Used) Total Swap : 512.0 MB (0 Used) System uptime : 0 days, 0 hour 4 min Load average : 0.42, 0.25, 0.10 OS : Debian GNU/Linux 12 Arch : x86_64 (64 Bit) Kernel : 6.1.0-22-amd64 TCP CC : bbr Virtualization : KVM IPv4/IPv6 : ✓ Online / ✗ Offline Organization : AS210644 AEZA INTERNATIONAL LTD Location : Amsterdam / NL Region : North Holland---------------------------------------------------------------------- I/O Speed(1st run) : 746 MB/s I/O Speed(2nd run) : 795 MB/s I/O Speed(3rd run) : 689 MB/s I/O Speed(average) : 743.3 MB/s---------------------------------------------------------------------- Node Name Upload Speed Download Speed Latency Speedtest.net 481.71 Mbps 920.67 Mbps 158.50 ms Los Angeles, US 554.28 Mbps 5374.82 Mbps 144.38 ms Dallas, US 694.22 Mbps 6234.85 Mbps 117.44 ms Montreal, CA 569.74 Mbps 868.78 Mbps 81.44 ms Amsterdam, NL 9297.40 Mbps 9386.14 Mbps 1.43 ms Mumbai, IN 626.55 Mbps 6085.88 Mbps 134.77 ms Singapore, SG 118.73 Mbps 34.11 Mbps 183.45 ms Tokyo, JP 304.91 Mbps 3170.27 Mbps 251.43 ms----------------------------------------------------------------------FIO Benchmark
read4k-rand: (groupid=0, jobs=16): err= 0: pid=2807: Tue Jul 9 17:05:14 2024 read: IOPS=1008, BW=4172KiB/s (4272kB/s)(245MiB/60013msec) slat (usec): min=2, max=65500, avg=15852.93, stdev=1848.37 clat (usec): min=3, max=2078.2k, avg=1981070.86, stdev=209967.15 lat (msec): min=5, max=2094, avg=1996.93, stdev=210.00 clat percentiles (msec): | 1.00th=[ 609], 5.00th=[ 1972], 10.00th=[ 1989], 20.00th=[ 2005], | 30.00th=[ 2005], 40.00th=[ 2022], 50.00th=[ 2022], 60.00th=[ 2022], | 70.00th=[ 2039], 80.00th=[ 2039], 90.00th=[ 2039], 95.00th=[ 2039], | 99.00th=[ 2039], 99.50th=[ 2039], 99.90th=[ 2056], 99.95th=[ 2056], | 99.99th=[ 2072] bw ( KiB/s): min= 3920, max= 5304, per=96.93%, avg=4044.58, stdev=23.01, samples=1910 iops : min= 980, max= 1326, avg=1011.10, stdev= 5.75, samples=1910 lat (usec) : 4=0.01%, 10=0.02% lat (msec) : 10=0.01%, 20=0.02%, 50=0.05%, 100=0.08%, 250=0.25% lat (msec) : 500=0.43%, 750=0.41%, 1000=0.43%, 2000=23.04%, >=2000=78.62% cpu : usr=0.04%, sys=0.18%, ctx=60071, majf=0, minf=0 IO depths : 1=0.0%, 2=0.0%, 4=0.0%, 8=0.0%, 16=0.0%, 32=0.0%, >=64=100.0% submit : 0=0.0%, 4=100.0%, 8=0.0%, 16=0.0%, 32=0.0%, 64=0.0%, >=64=0.0% complete : 0=0.0%, 4=100.0%, 8=0.0%, 16=0.0%, 32=0.0%, 64=0.0%, >=64=0.1% issued rwts: total=60545,0,0,0 short=0,0,0,0 dropped=0,0,0,0 latency : target=0, window=0, percentile=100.00%, depth=128read64k-seq: (groupid=1, jobs=16): err= 0: pid=2823: Tue Jul 9 17:05:14 2024 read: IOPS=4001, BW=252MiB/s (264MB/s)(14.6GiB/59355msec) slat (usec): min=5, max=45435, avg=3995.96, stdev=9042.63 clat (usec): min=2, max=527819, avg=505484.84, stdev=29404.10 lat (usec): min=11, max=527829, avg=509479.87, stdev=28011.28 clat percentiles (msec): | 1.00th=[ 477], 5.00th=[ 481], 10.00th=[ 489], 20.00th=[ 506], | 30.00th=[ 510], 40.00th=[ 510], 50.00th=[ 514], 60.00th=[ 514], | 70.00th=[ 514], 80.00th=[ 514], 90.00th=[ 514], 95.00th=[ 514], | 99.00th=[ 514], 99.50th=[ 514], 99.90th=[ 518], 99.95th=[ 523], | 99.99th=[ 527] bw ( KiB/s): min=245760, max=263581, per=99.25%, avg=256352.89, stdev=405.26, samples=1888 iops : min= 3840, max= 4112, avg=4002.68, stdev= 6.33, samples=1888 lat (usec) : 4=0.01%, 20=0.01%, 50=0.01% lat (msec) : 2=0.01%, 4=0.01%, 10=0.01%, 20=0.02%, 50=0.05% lat (msec) : 100=0.09%, 250=0.25%, 500=15.05%, 750=85.36% cpu : usr=0.02%, sys=1.00%, ctx=58284, majf=0, minf=0 IO depths : 1=0.0%, 2=0.0%, 4=0.0%, 8=0.0%, 16=0.0%, 32=0.0%, >=64=100.0% submit : 0=0.0%, 4=100.0%, 8=0.0%, 16=0.0%, 32=0.0%, 64=0.0%, >=64=0.0% complete : 0=0.0%, 4=100.0%, 8=0.0%, 16=0.0%, 32=0.0%, 64=0.0%, >=64=0.1% issued rwts: total=237490,0,0,0 short=0,0,0,0 dropped=0,0,0,0 latency : target=0, window=0, percentile=100.00%, depth=128write4k-rand: (groupid=2, jobs=16): err= 0: pid=2839: Tue Jul 9 17:05:14 2024 write: IOPS=558, BW=2370KiB/s (2427kB/s)(139MiB/60201msec); 0 zone resets slat (usec): min=3, max=208109, avg=28673.75, stdev=70865.63 clat (usec): min=2, max=10004k, avg=3489488.75, stdev=2212516.50 lat (usec): min=23, max=10004k, avg=3517422.75, stdev=2228382.22 clat percentiles (msec): | 1.00th=[ 609], 5.00th=[ 1838], 10.00th=[ 1838], 20.00th=[ 2039], | 30.00th=[ 2232], 40.00th=[ 2232], 50.00th=[ 2433], 60.00th=[ 2668], | 70.00th=[ 3272], 80.00th=[ 5134], 90.00th=[ 7550], 95.00th=[ 8557], | 99.00th=[ 9329], 99.50th=[ 9597], 99.90th=[ 9731], 99.95th=[ 9731], | 99.99th=[ 9866] bw ( KiB/s): min= 512, max= 5976, per=94.14%, avg=2231.31, stdev=86.74, samples=1909 iops : min= 128, max= 1494, avg=557.78, stdev=21.68, samples=1909 lat (usec) : 4=0.01%, 10=0.04%, 20=0.01%, 50=0.01% lat (msec) : 250=0.52%, 500=0.48%, 750=0.41%, 1000=0.36%, 2000=11.38% lat (msec) : >=2000=92.84% cpu : usr=0.00%, sys=0.04%, ctx=4762, majf=0, minf=0 IO depths : 1=0.0%, 2=0.0%, 4=0.0%, 8=0.0%, 16=0.0%, 32=0.0%, >=64=100.0% submit : 0=0.0%, 4=100.0%, 8=0.0%, 16=0.0%, 32=0.0%, 64=0.0%, >=64=0.0% complete : 0=0.0%, 4=100.0%, 8=0.0%, 16=0.0%, 32=0.0%, 64=0.0%, >=64=0.1% issued rwts: total=0,33620,0,0 short=0,0,0,0 dropped=0,0,0,0 latency : target=0, window=0, percentile=100.00%, depth=128write64k-seq: (groupid=3, jobs=16): err= 0: pid=2855: Tue Jul 9 17:05:14 2024 write: IOPS=112, BW=7528KiB/s (7708kB/s)(445MiB/60501msec); 0 zone resets slat (usec): min=46, max=615919, avg=141957.90, stdev=121752.39 clat (usec): min=4, max=29011k, avg=14075348.42, stdev=5403032.38 lat (msec): min=203, max=29087, avg=14224.48, stdev=5441.77 clat percentiles (msec): | 1.00th=[ 625], 5.00th=[ 3071], 10.00th=[ 5738], 20.00th=[ 9194], | 30.00th=[14429], 40.00th=[14697], 50.00th=[14832], 60.00th=[15368], | 70.00th=[15905], 80.00th=[16576], 90.00th=[17113], 95.00th=[17113], | 99.00th=[17113], 99.50th=[17113], 99.90th=[17113], 99.95th=[17113], | 99.99th=[17113] bw ( KiB/s): min= 2165, max=24570, per=100.00%, avg=8625.15, stdev=272.62, samples=1196 iops : min= 23, max= 380, avg=132.64, stdev= 4.28, samples=1196 lat (usec) : 10=0.19%, 20=0.04% lat (msec) : 250=0.22%, 500=0.34%, 750=0.31%, 1000=0.38%, 2000=1.68% lat (msec) : >=2000=101.43% cpu : usr=0.03%, sys=0.03%, ctx=4753, majf=0, minf=0 IO depths : 1=0.0%, 2=0.0%, 4=0.0%, 8=0.0%, 16=2.7%, 32=7.5%, >=64=89.8% submit : 0=0.0%, 4=100.0%, 8=0.0%, 16=0.0%, 32=0.0%, 64=0.0%, >=64=0.0% complete : 0=0.0%, 4=99.7%, 8=0.0%, 16=0.0%, 32=0.0%, 64=0.0%, >=64=0.3% issued rwts: total=0,6804,0,0 short=0,0,0,0 dropped=0,0,0,0 latency : target=0, window=0, percentile=100.00%, depth=128
Run status group 0 (all jobs): READ: bw=4172KiB/s (4272kB/s), 4172KiB/s-4172KiB/s (4272kB/s-4272kB/s), io=245MiB (256MB), run=60013-60013msec
Run status group 1 (all jobs): READ: bw=252MiB/s (264MB/s), 252MiB/s-252MiB/s (264MB/s-264MB/s), io=14.6GiB (15.7GB), run=59355-59355msec
Run status group 2 (all jobs): WRITE: bw=2370KiB/s (2427kB/s), 2370KiB/s-2370KiB/s (2427kB/s-2427kB/s), io=139MiB (146MB), run=60201-60201msec
Run status group 3 (all jobs): WRITE: bw=7528KiB/s (7708kB/s), 7528KiB/s-7528KiB/s (7708kB/s-7708kB/s), io=445MiB (466MB), run=60501-60501msec
Disk stats (read/write): vda: ios=131687/137160, merge=0/3535, ticks=3133156/6436983, in_queue=9573024, util=94.03%Below is the GPT-generated explanation based on the above fio results:
Based on the provided disk performance benchmark results, we can draw the following conclusions:
- read4k-rand group:
- IOPS is 1008 with 4172 KiB/s bandwidth; read throughput is relatively stable.
- Average read latency is about 1.99 seconds, and 99% of requests complete within 2.07 seconds.
- CPU utilization is low, while most I/O depth is at 64, indicating a heavily loaded storage backend.
- read64k-seq group:
- IOPS is 4001 with 252 MiB/s bandwidth; read throughput is quite high.
- Average read latency is about 509.48 ms, and 99% of requests complete within 0.53 seconds.
- CPU utilization is low, with most I/O depth at 64, again suggesting a heavily loaded storage backend.
- write4k-rand group:
- IOPS is 558 with 2370 KiB/s bandwidth; write throughput is relatively stable.
- Average write latency is about 3.49 seconds, and 99% of requests complete within 9.73 seconds.
- CPU utilization is low, with most I/O depth at 64, indicating the storage system is under significant pressure.
- write64k-seq group:
- IOPS is 112 with 7528 KiB/s bandwidth; sequential write throughput is decent.
- Average write latency is about 14.22 seconds, and 99% of requests complete within 17.11 seconds.
- CPU utilization is low, with most I/O depth at 64, which suggests the backend storage is close to saturation.
Overall, the disk performance benchmark shows generally acceptable throughput for both reads and writes, but latency for part of the workload is quite high. Further tuning and optimization of the storage system may be required to improve performance.