193 字
1 分钟
Building a BT Downloader Traffic Dashboard on Your Server with Grafana and Prometheus
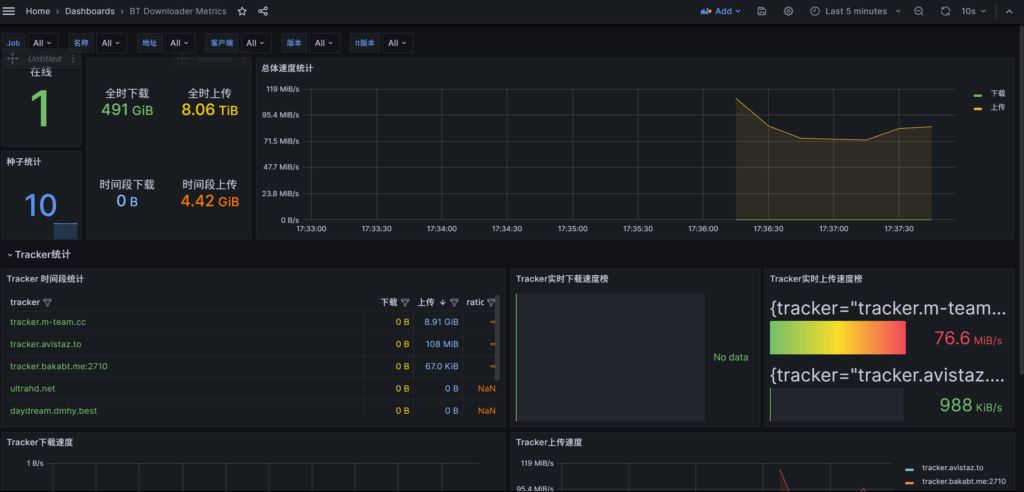
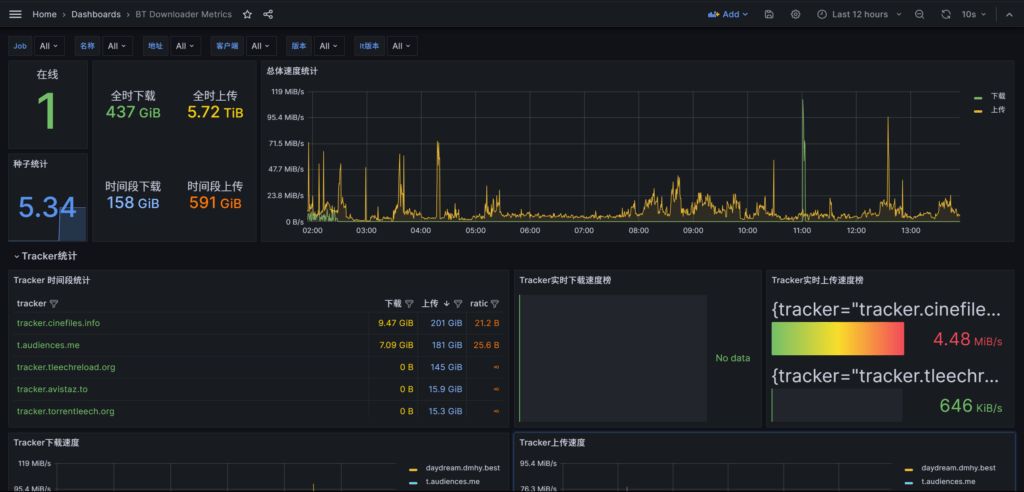
Result
Prerequisites
-
Grafana and Prometheus are already deployed and running
-
Have the usernames/passwords for all your downloaders ready and make sure they are reachable
Prepare the config file
vim config.yml
root@Sakura:~# cat config.ymlqb:
client: qbittorrent
host: http://ip:8080
username: your username
password: password
qb2:
client: qbittorrent
host: http://ip:8080
username: your username
password: password
de:
client: deluge
host: http://ip:prot
username: your username
password: password
tr:
client: Transmission
host: http://ip:prot
username: your username
password: passwordDeployment
docker run -d -p 9000:9000 -v /root/config.yml:/config/config.yml leishi1313/downloader-exporterHere /root/config.yml is the path to the file you created above. You can use the pwd command to check the current directory.

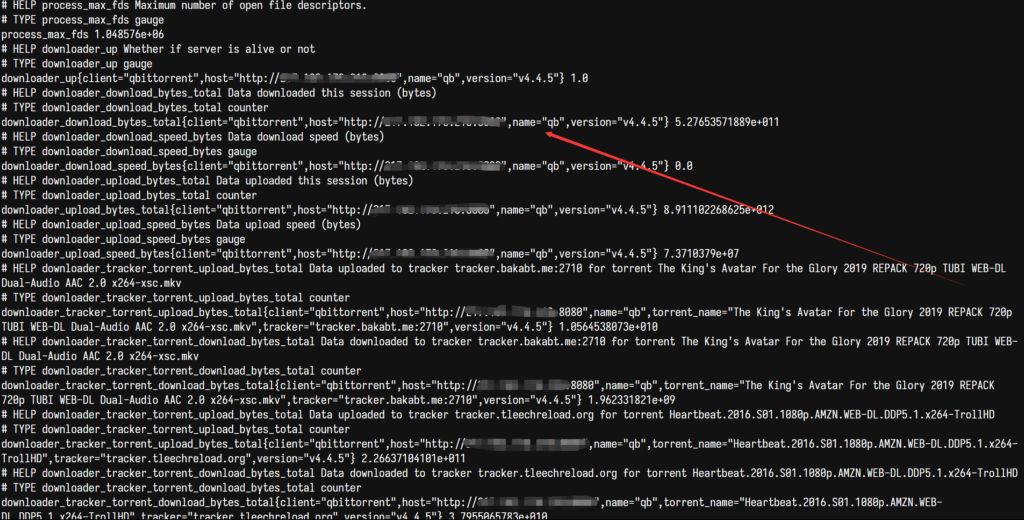
Check connectivity
Visit IP:9000 and confirm that you see a page like the following. If you get similar output, it means downloader-exporter has been successfully deployed.
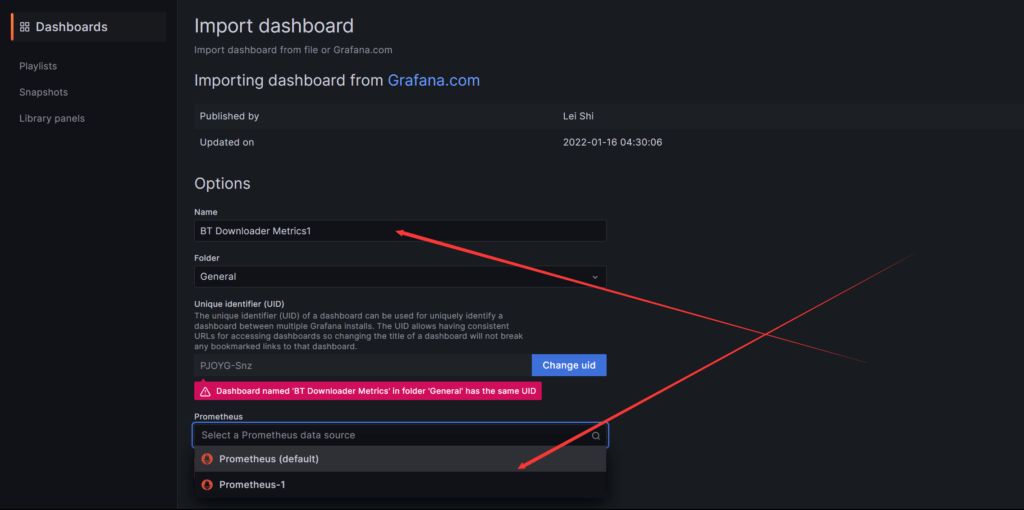
Create a new panel in Grafana
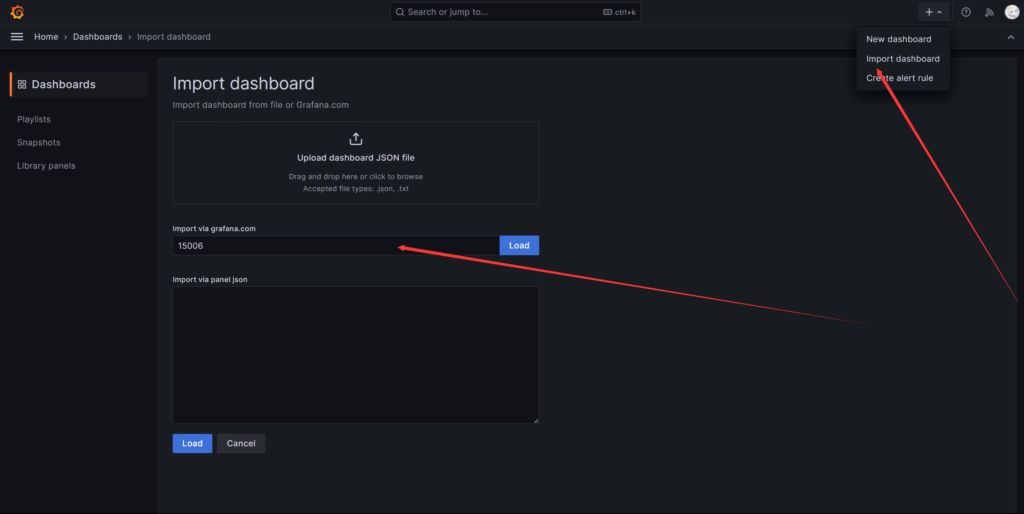
Select the data source
Building a BT Downloader Traffic Dashboard on Your Server with Grafana and Prometheus
https://catcat.blog/en/grafana-promethus-bt-dashboard.html