ProxMenux Monitor: A New-Generation Proxmox Server Monitoring Tool
Introduction to ProxMenux
ProxMenux is an administration tool for Proxmox VE (Virtual Environment). It provides a menu-based, interactive interface that lets administrators run common commands and scripts more easily, without having to manually type complex commands every time.
The New ProxMenux Monitor
The latest release of ProxMenux Monitor introduces a new feature, added in version v1.1.7.
It’s a brand-new interface for monitoring your Proxmox infrastructure, designed with future updates in mind:
- GUI-based operations without needing a terminal
- Built to work across multiple devices and form factors
- Designed for modularity and extensibility
Features
- System overview – Monitor the server status in real time. You can check information such as CPU, memory, temperature, system load, and more.
- Storage management – View the status of all disks and volumes, and get detailed information for each storage device: capacity, utilization, SMART health, temperature, and performance.
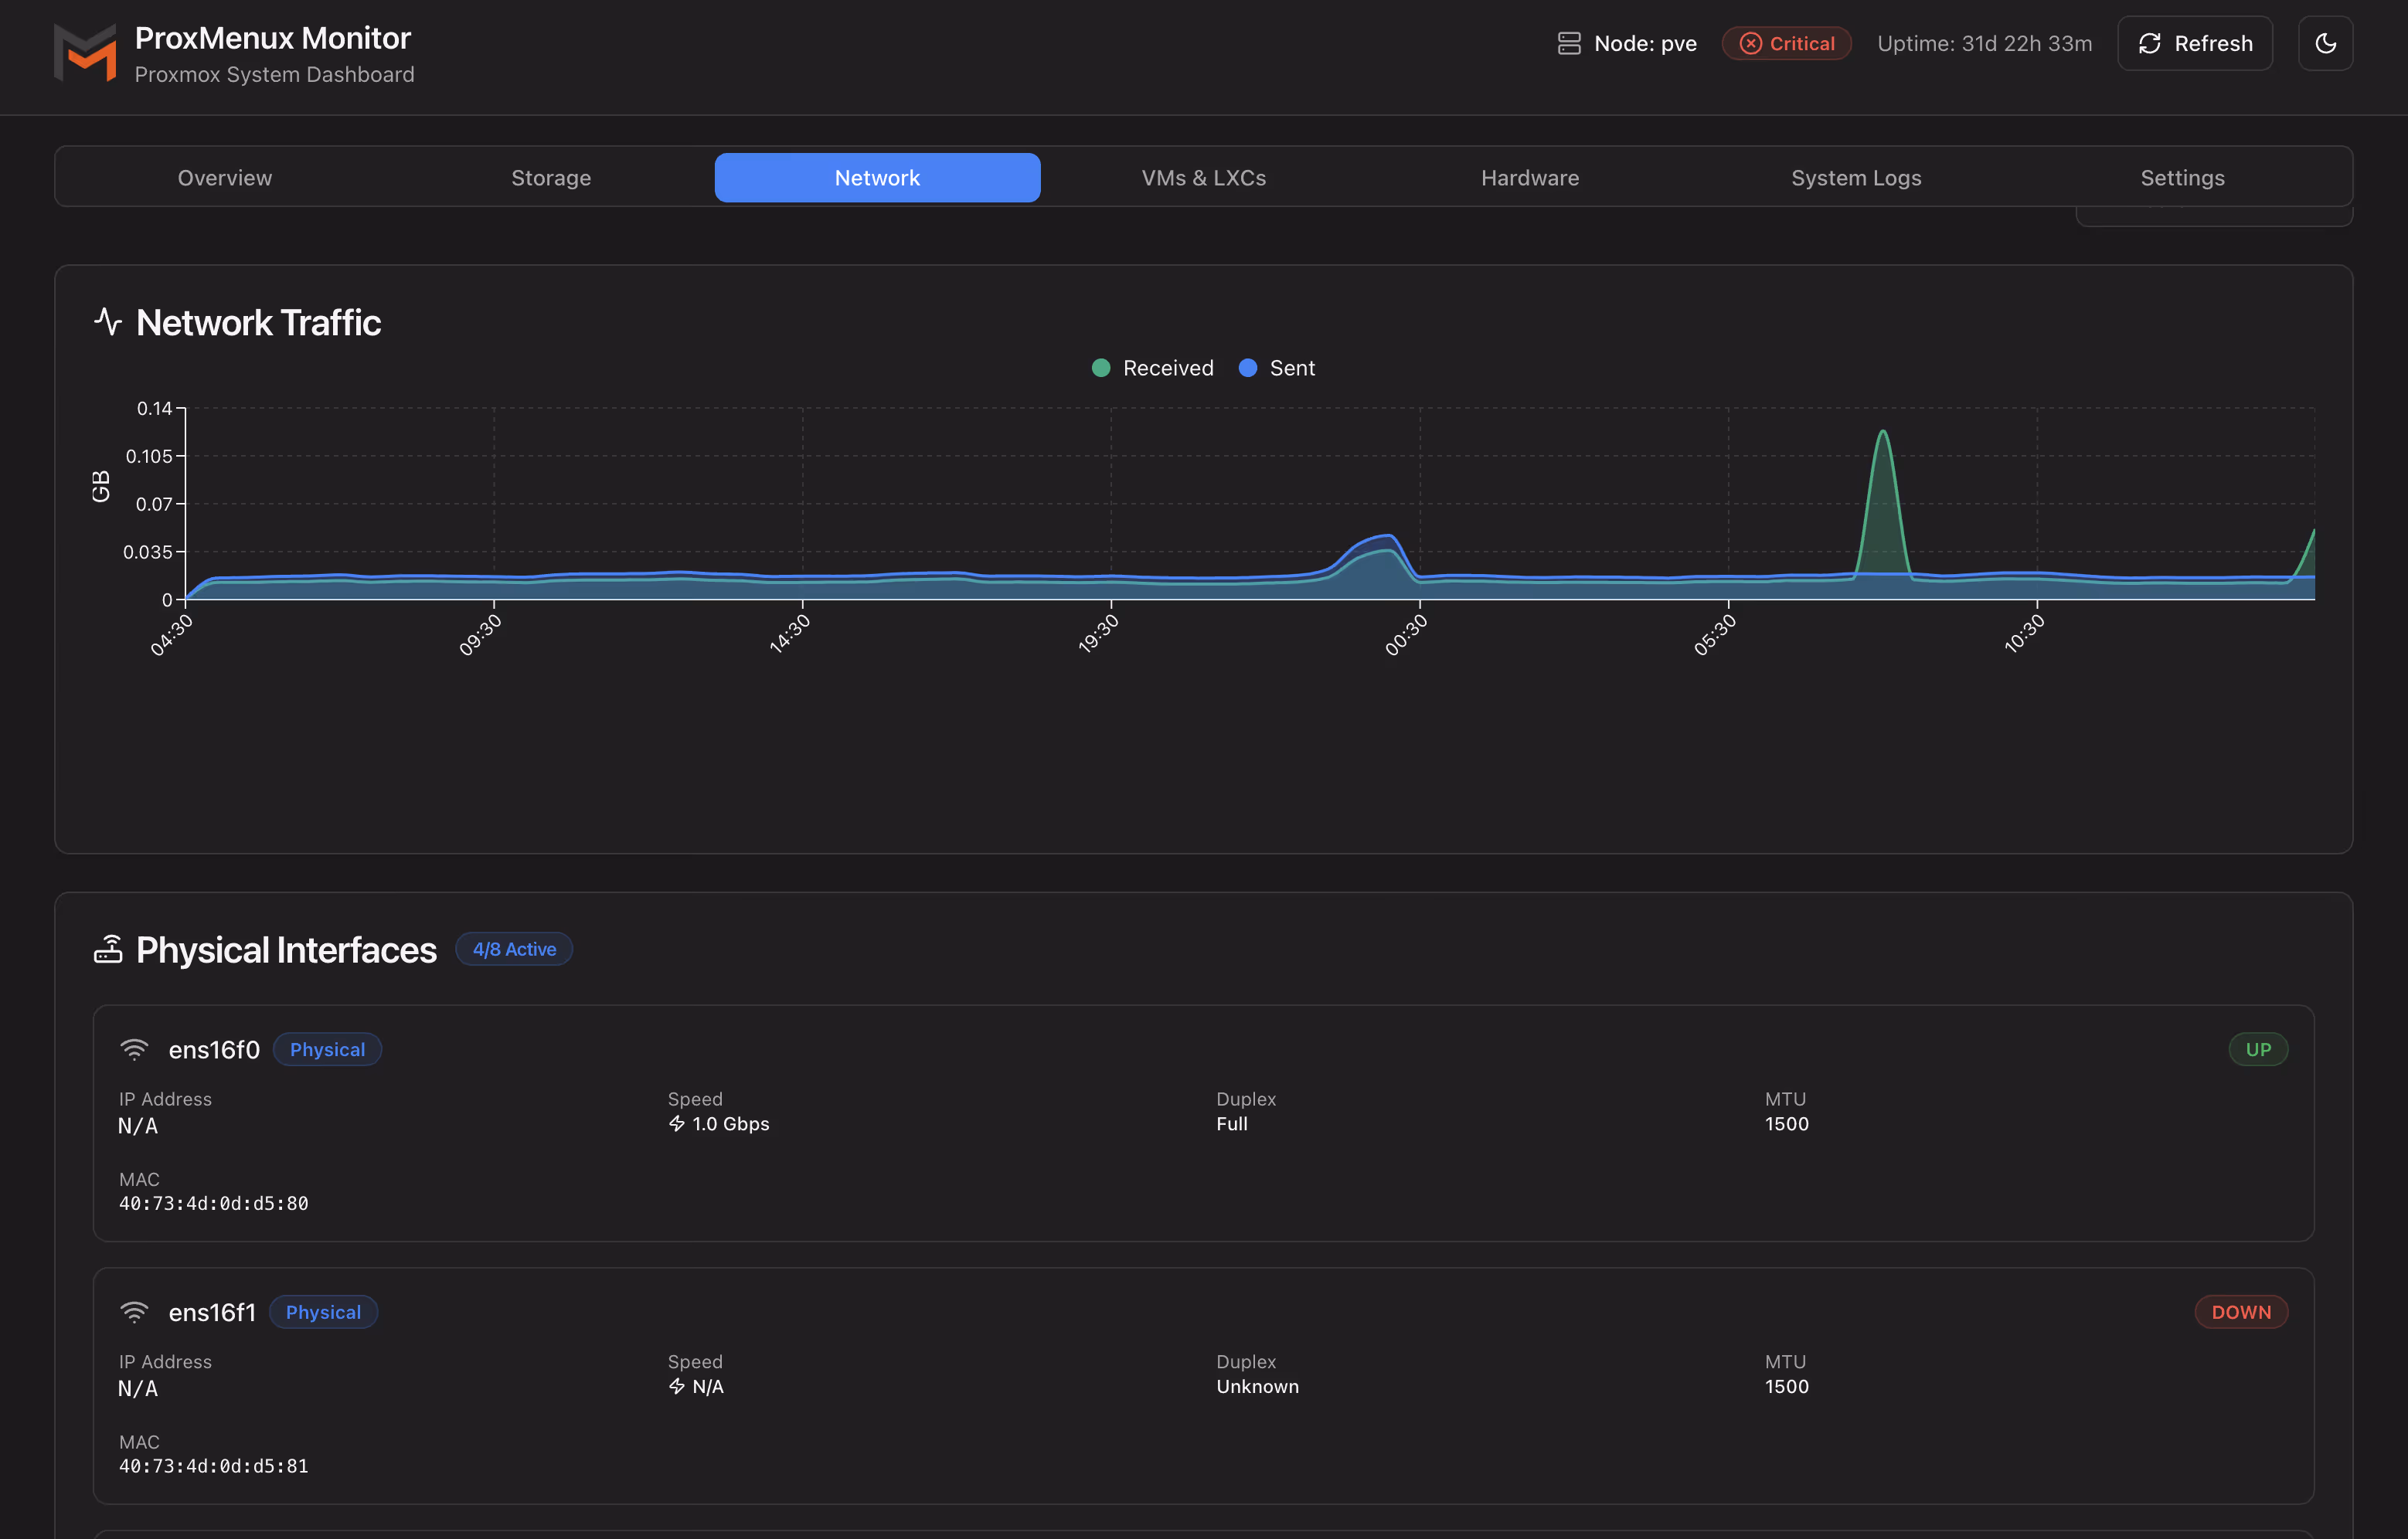
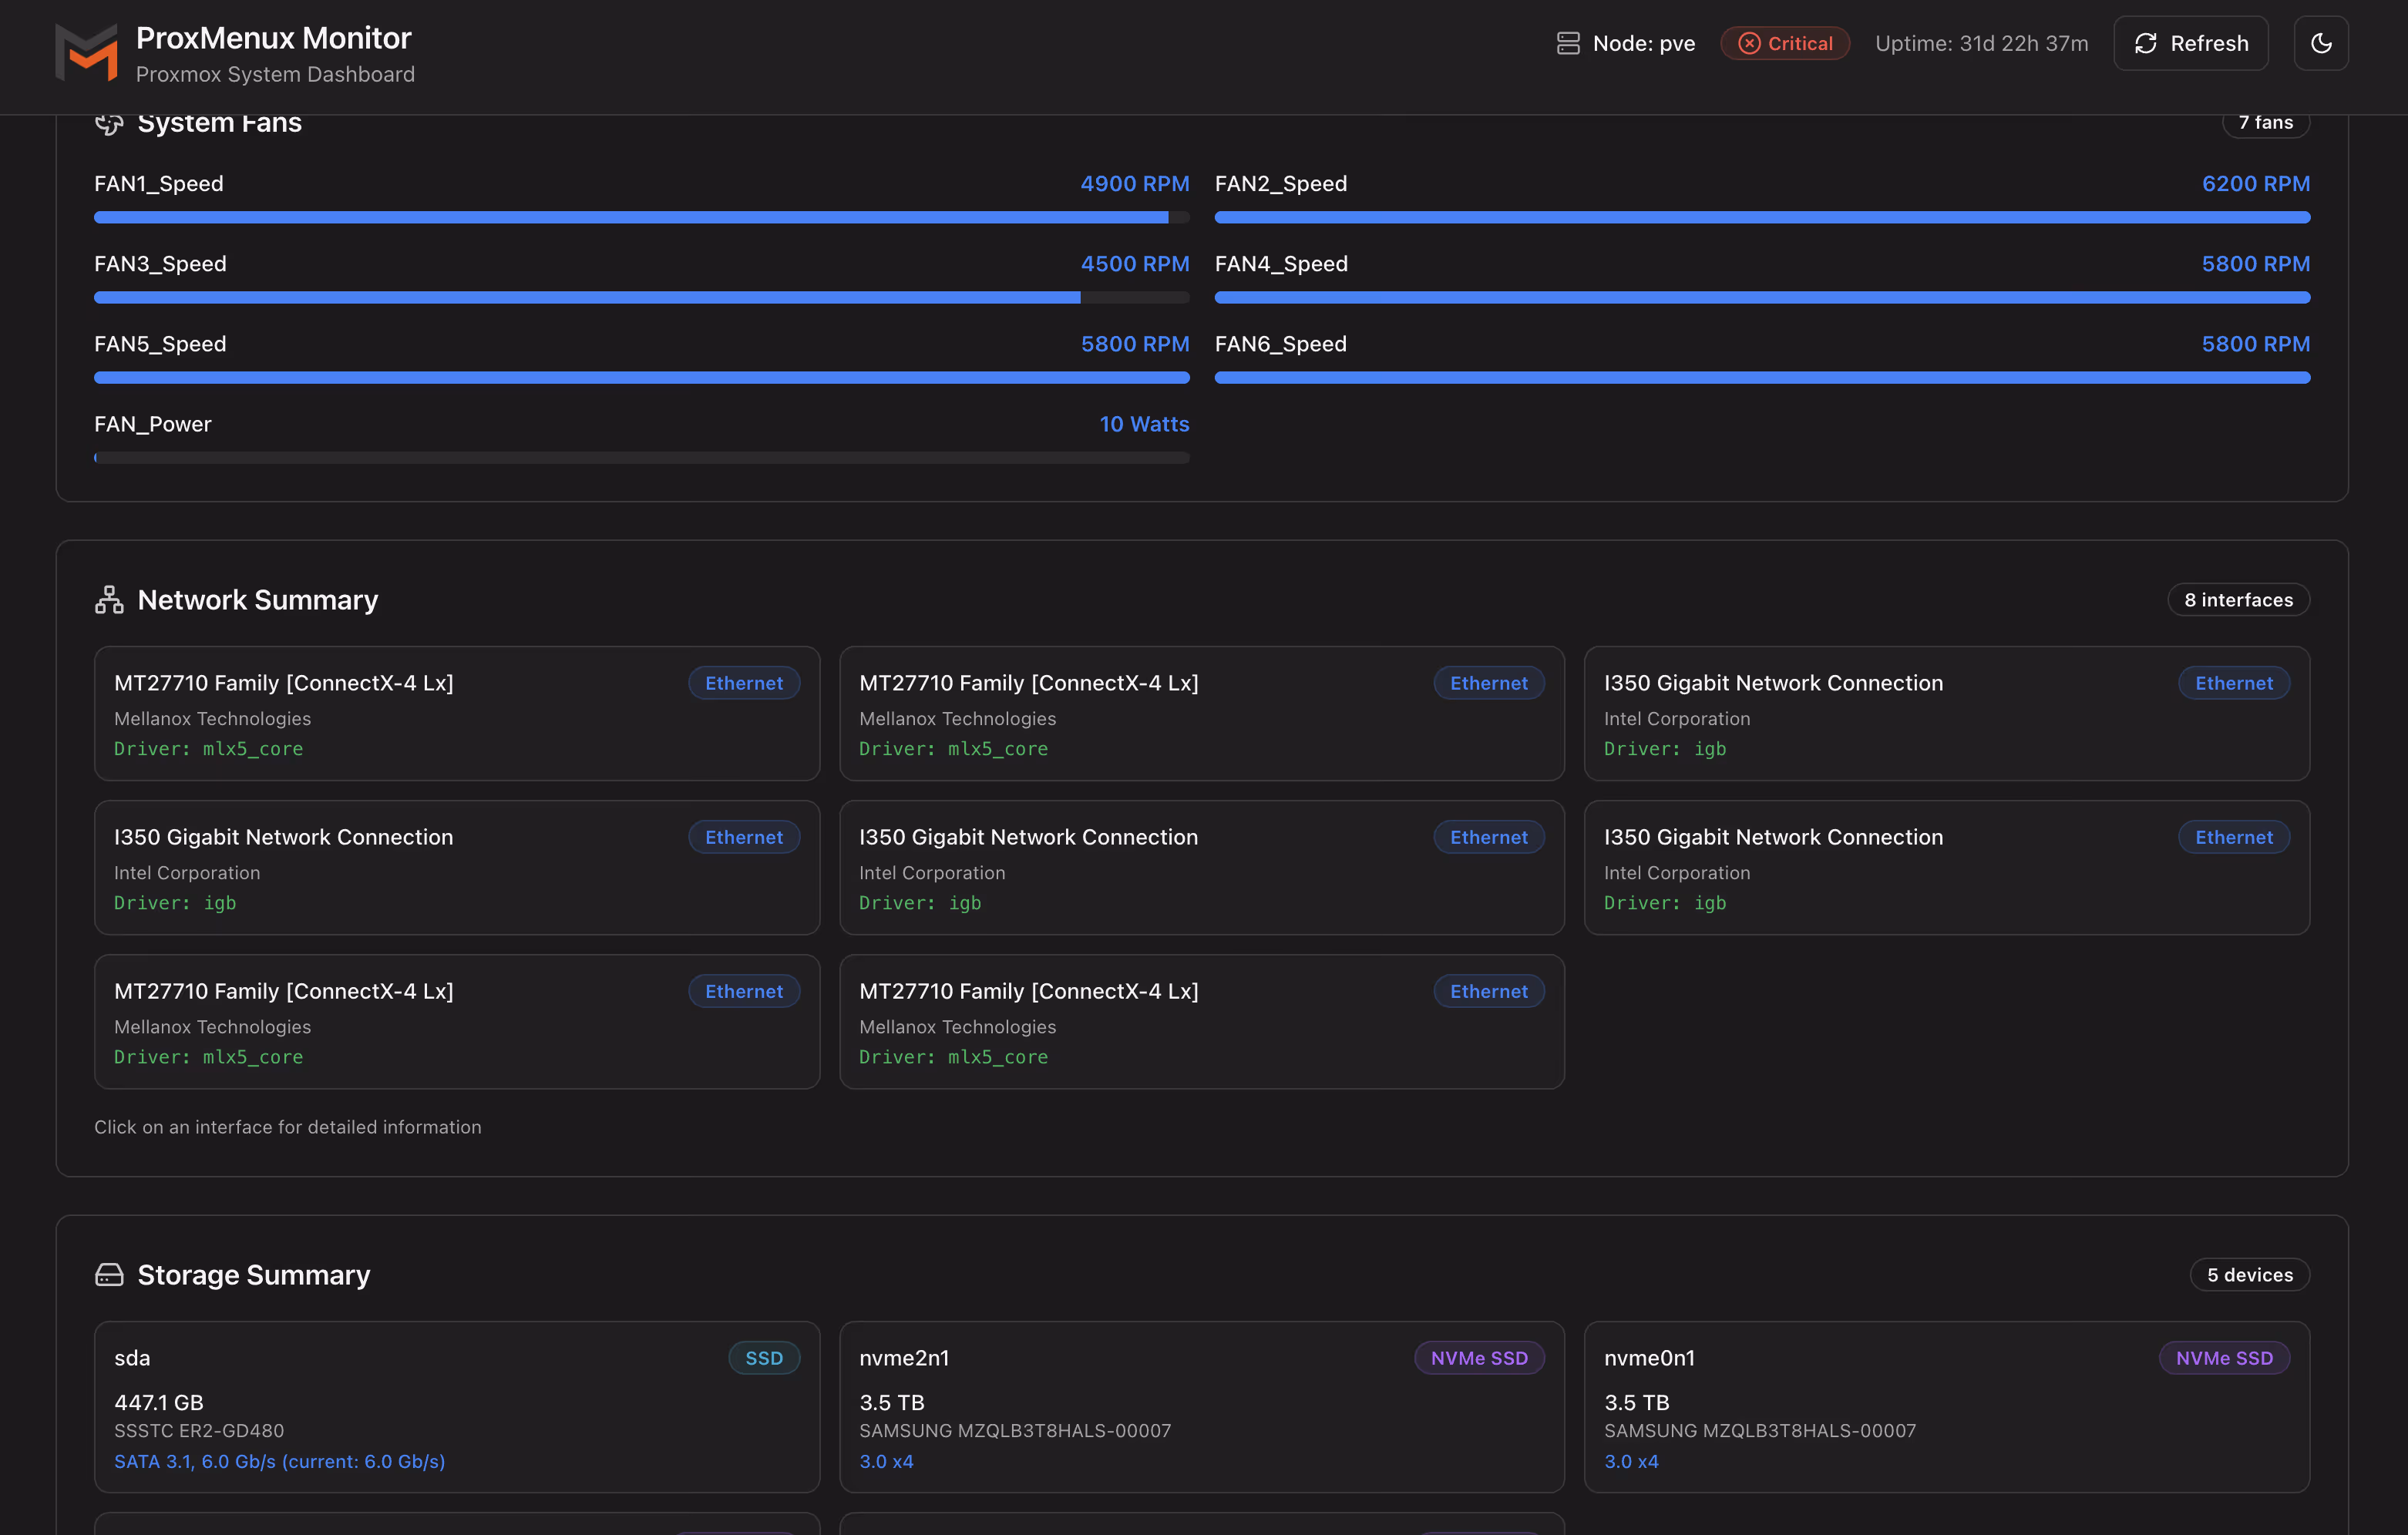
- Network metrics – Monitor network traffic in real time. It provides bandwidth statistics, active interfaces, transfer speeds, and historical usage charts.
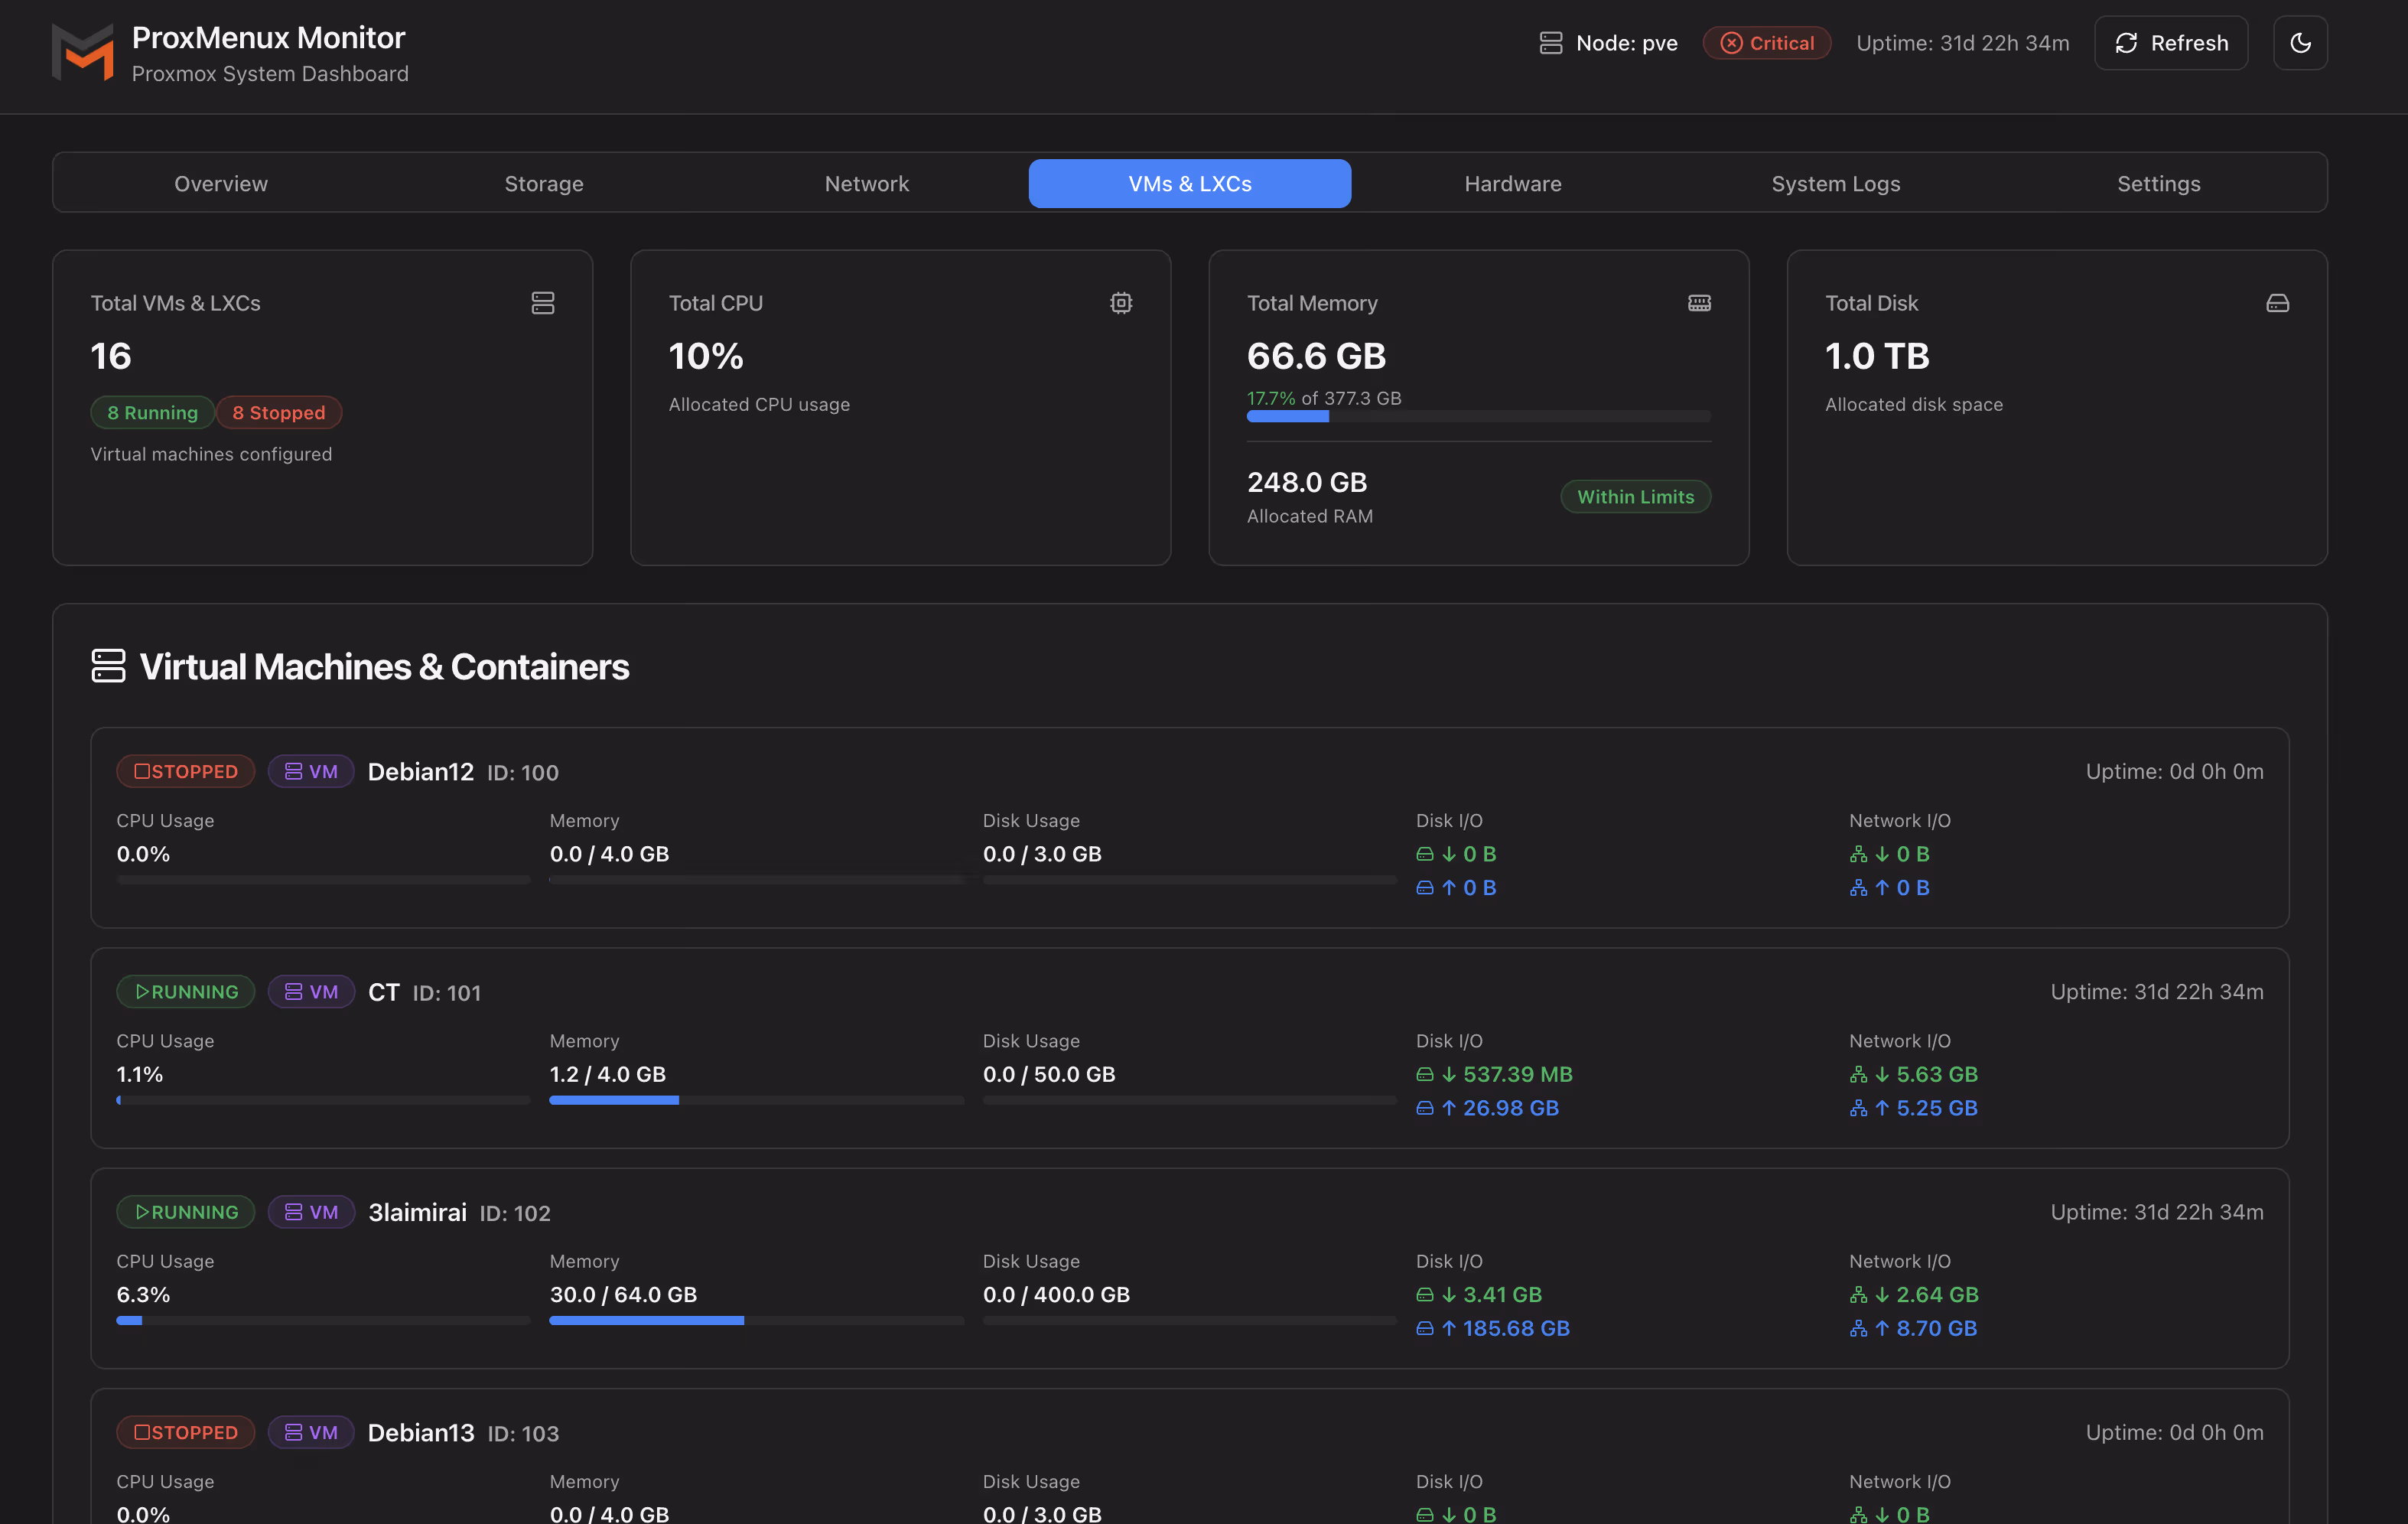
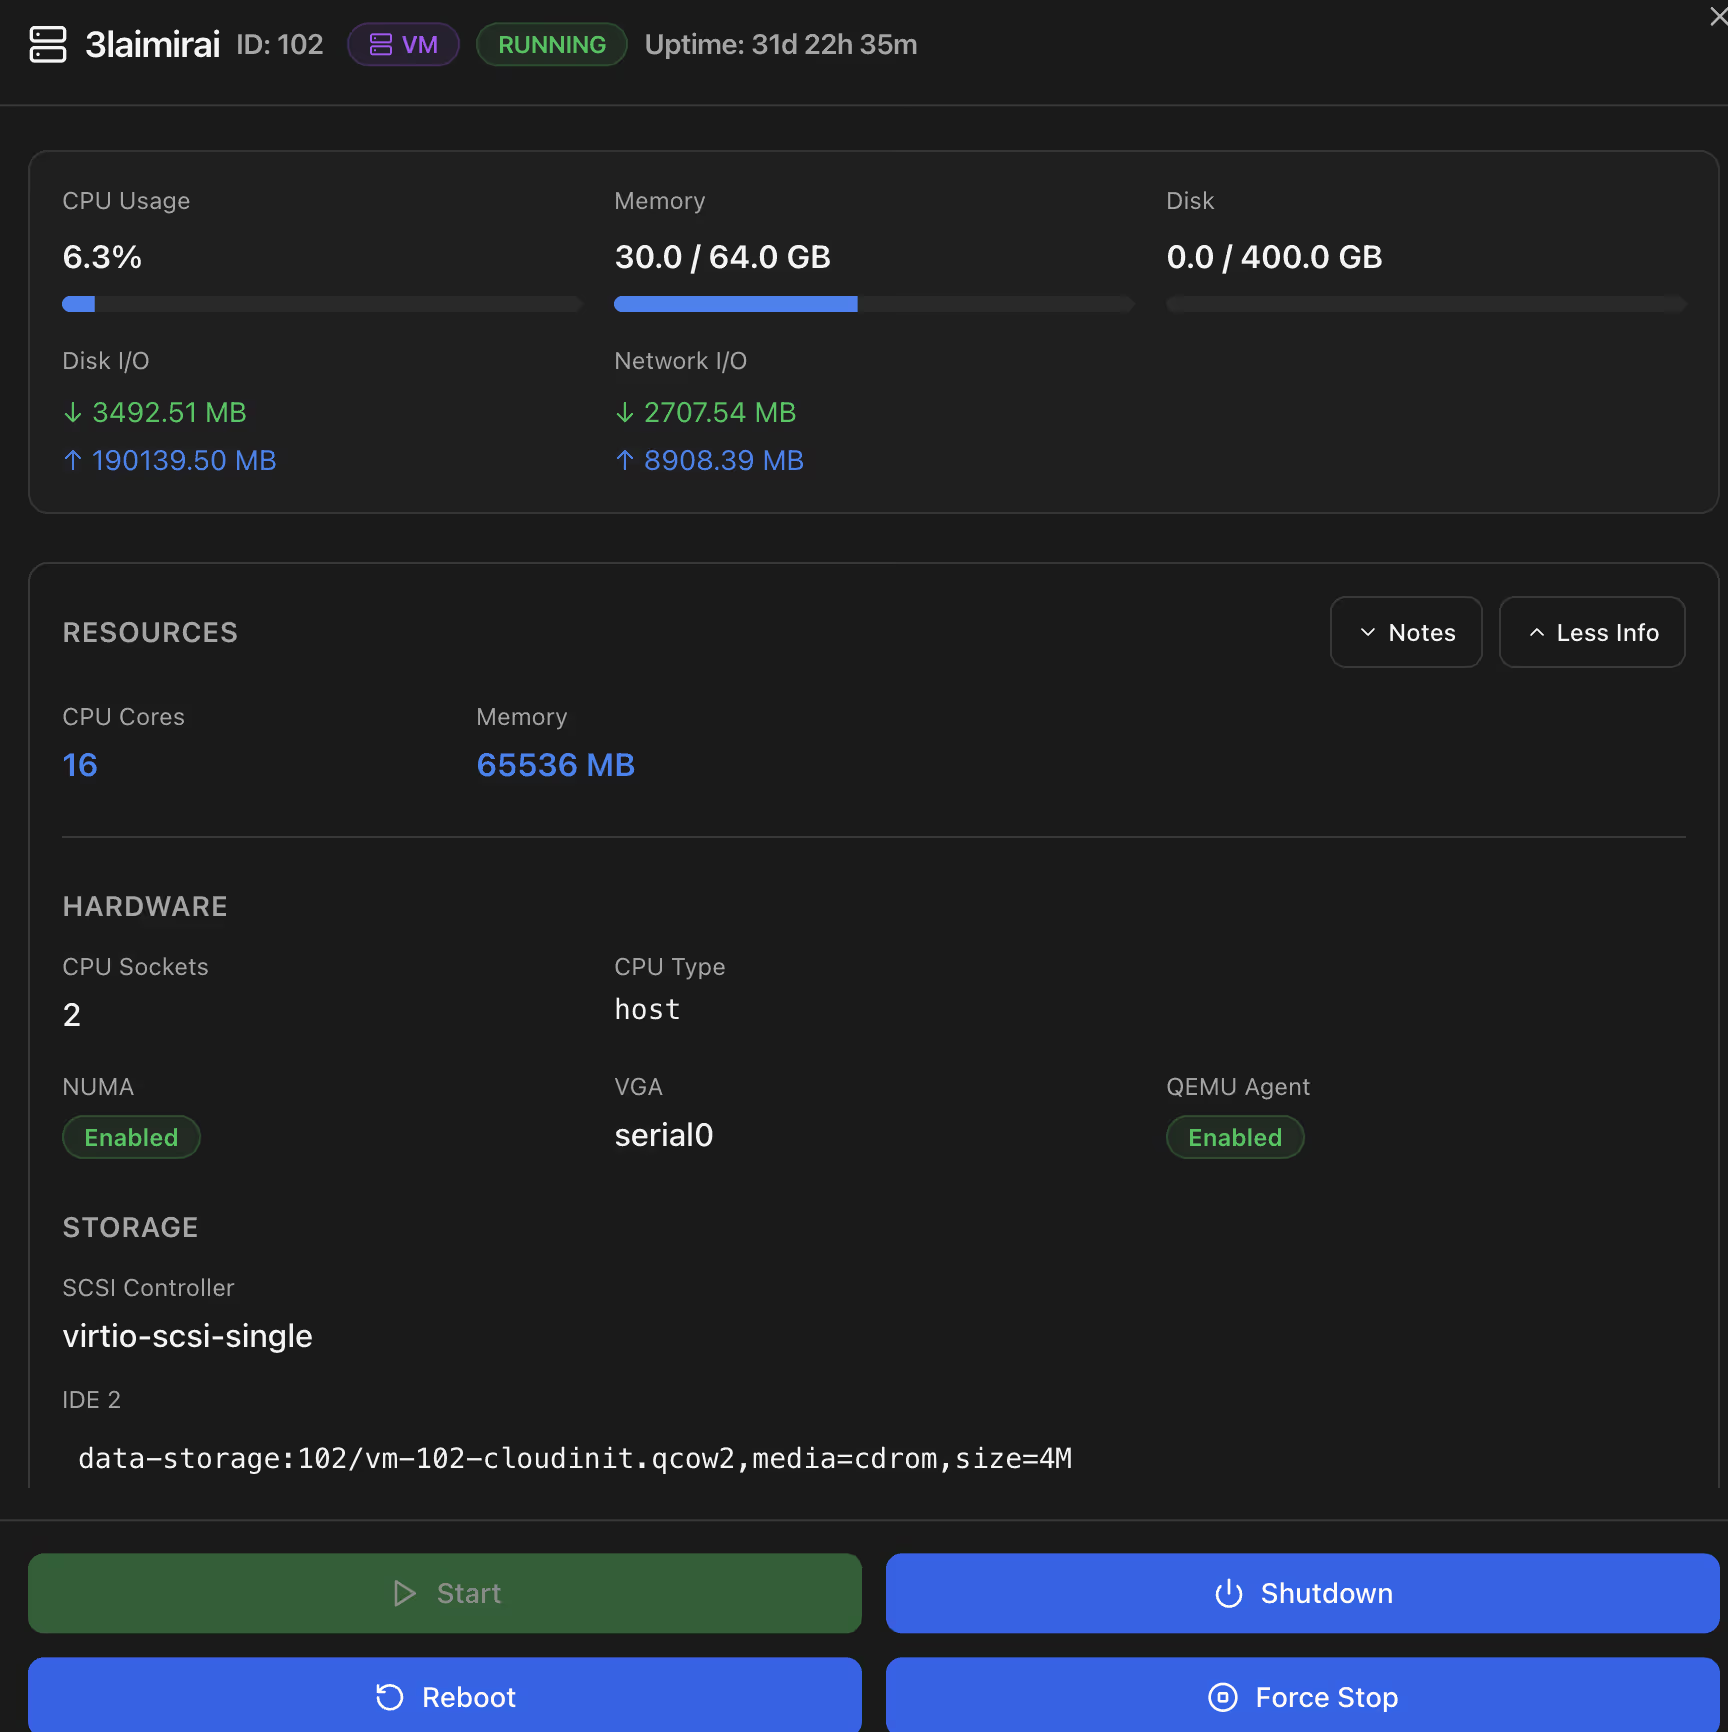
- Virtual machines and containers – Manage your VMs and LXC containers from a single place. View their status, allocated resources, current usage, and perform quick actions like start and stop.
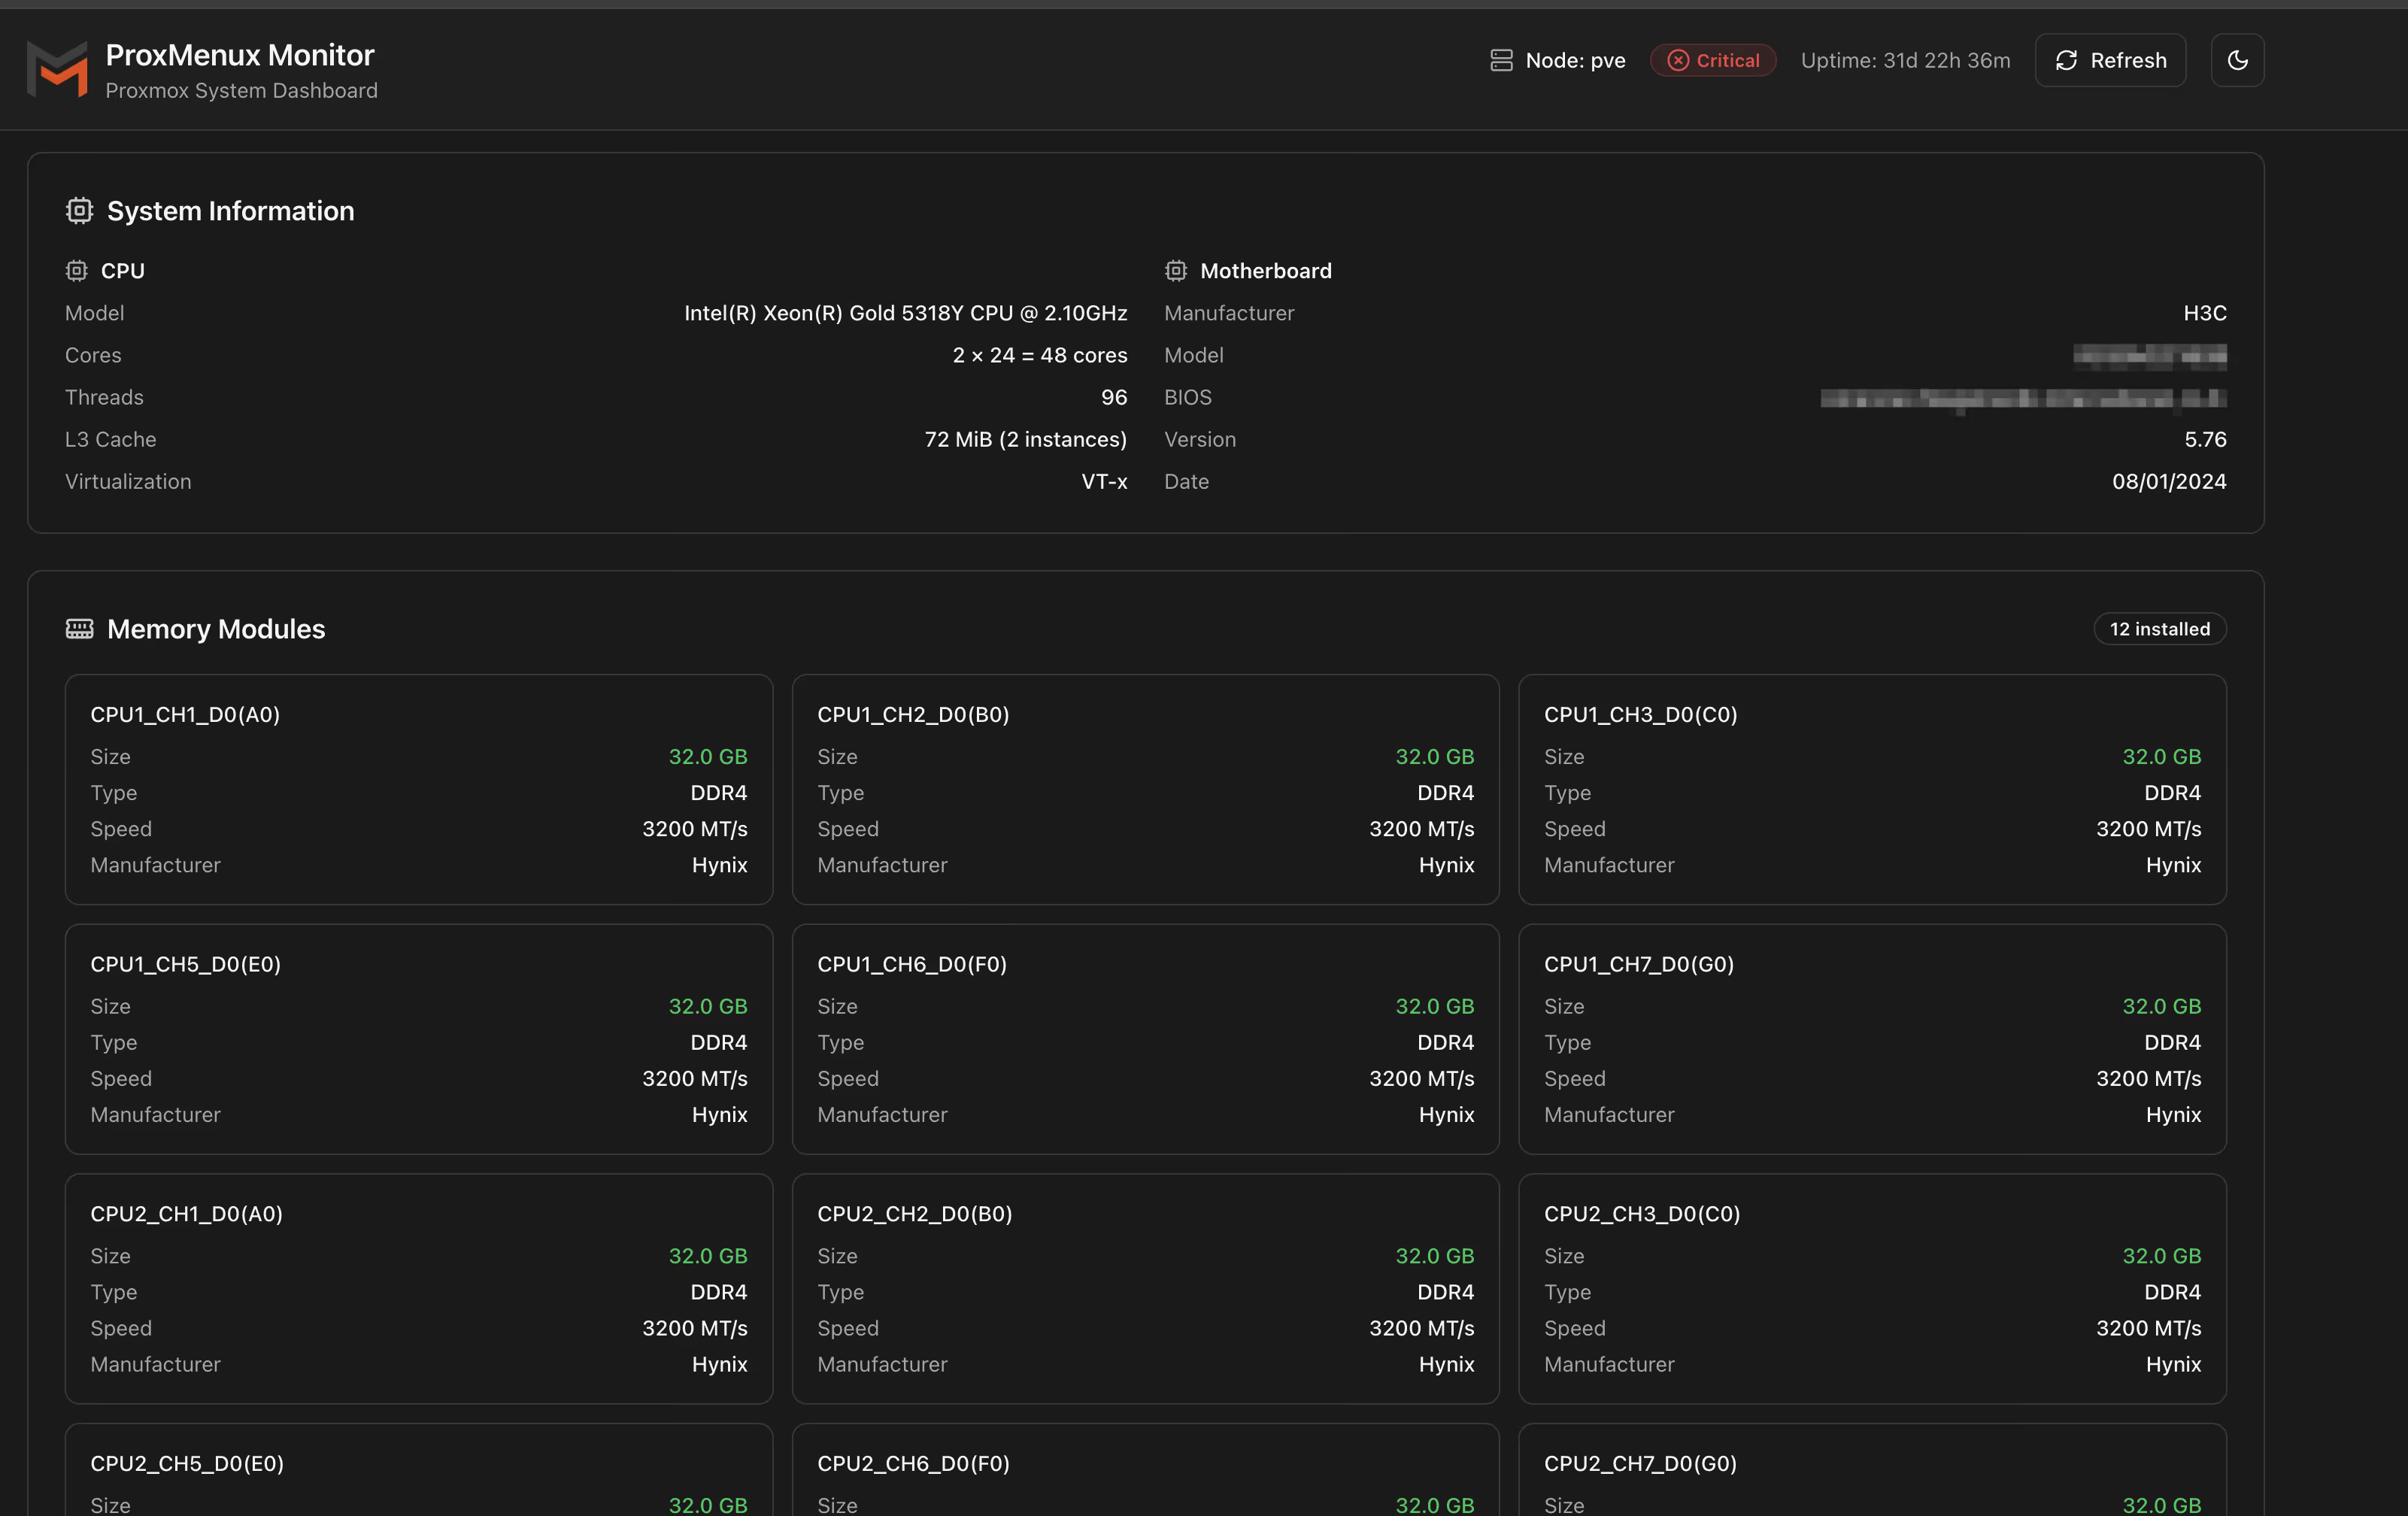
- Hardware information – Get detailed data about server hardware, including CPU, memory, GPU, disks, networking, UPS, and other metrics such as technical specs, model, serial number, and health status.
- System logs – View logs in real time, filter by event type, search for errors, and track overall server activity.
Installing ProxMenux and ProxMenux Monitor
bash -c "$(wget -qLO - https://raw.githubusercontent.com/MacRimi/ProxMenux/main/install_proxmenux.sh)"Choose the version:

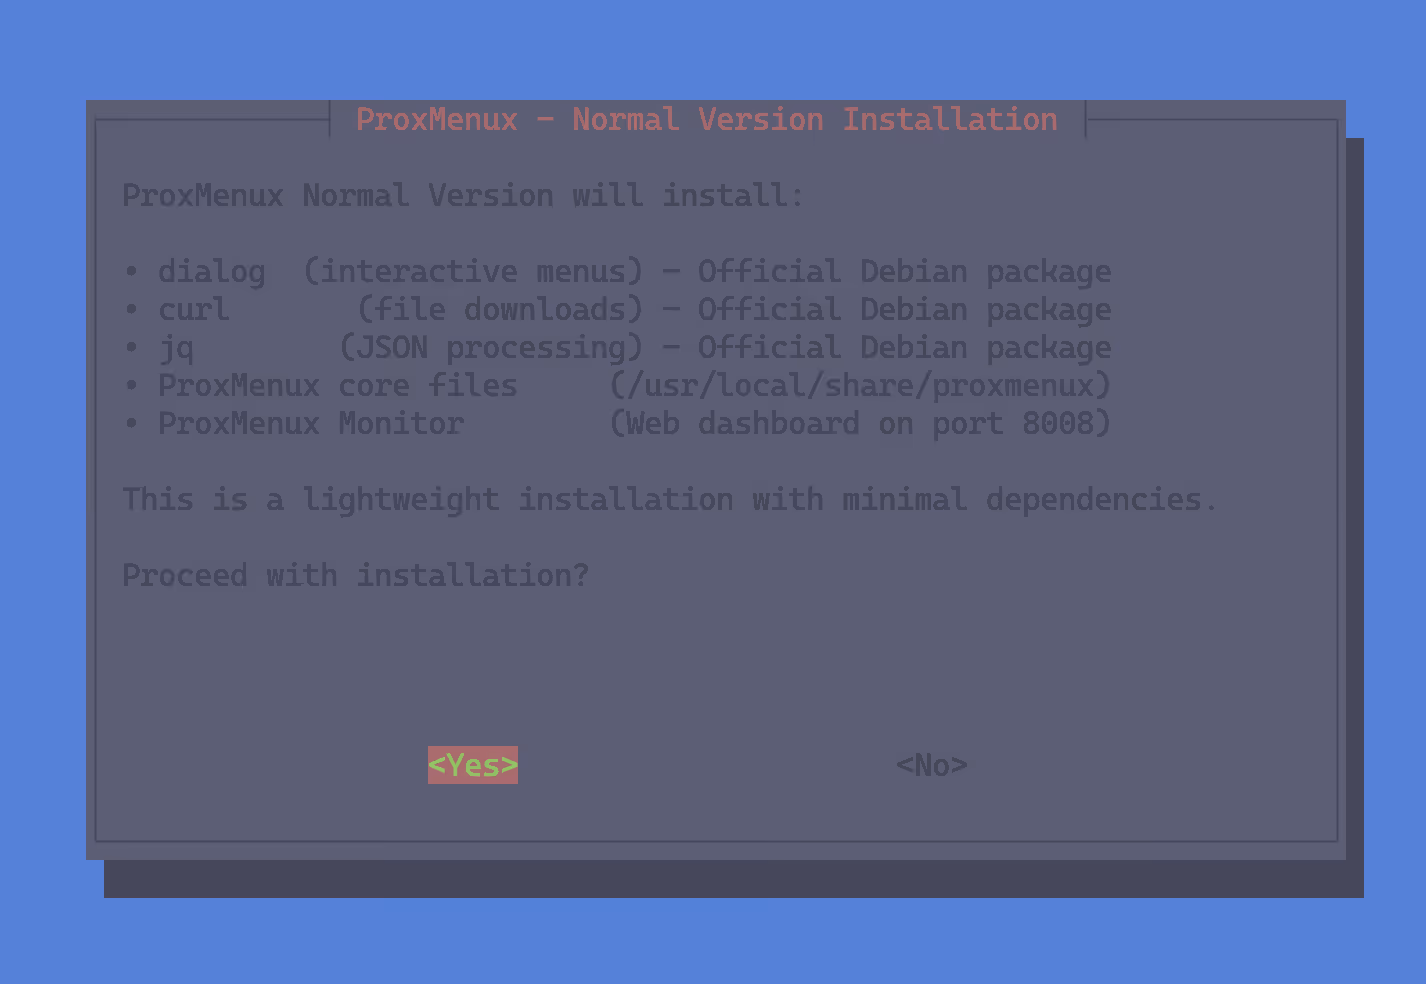
Check the installation options; it will prompt that the service will be installed on port 8008.
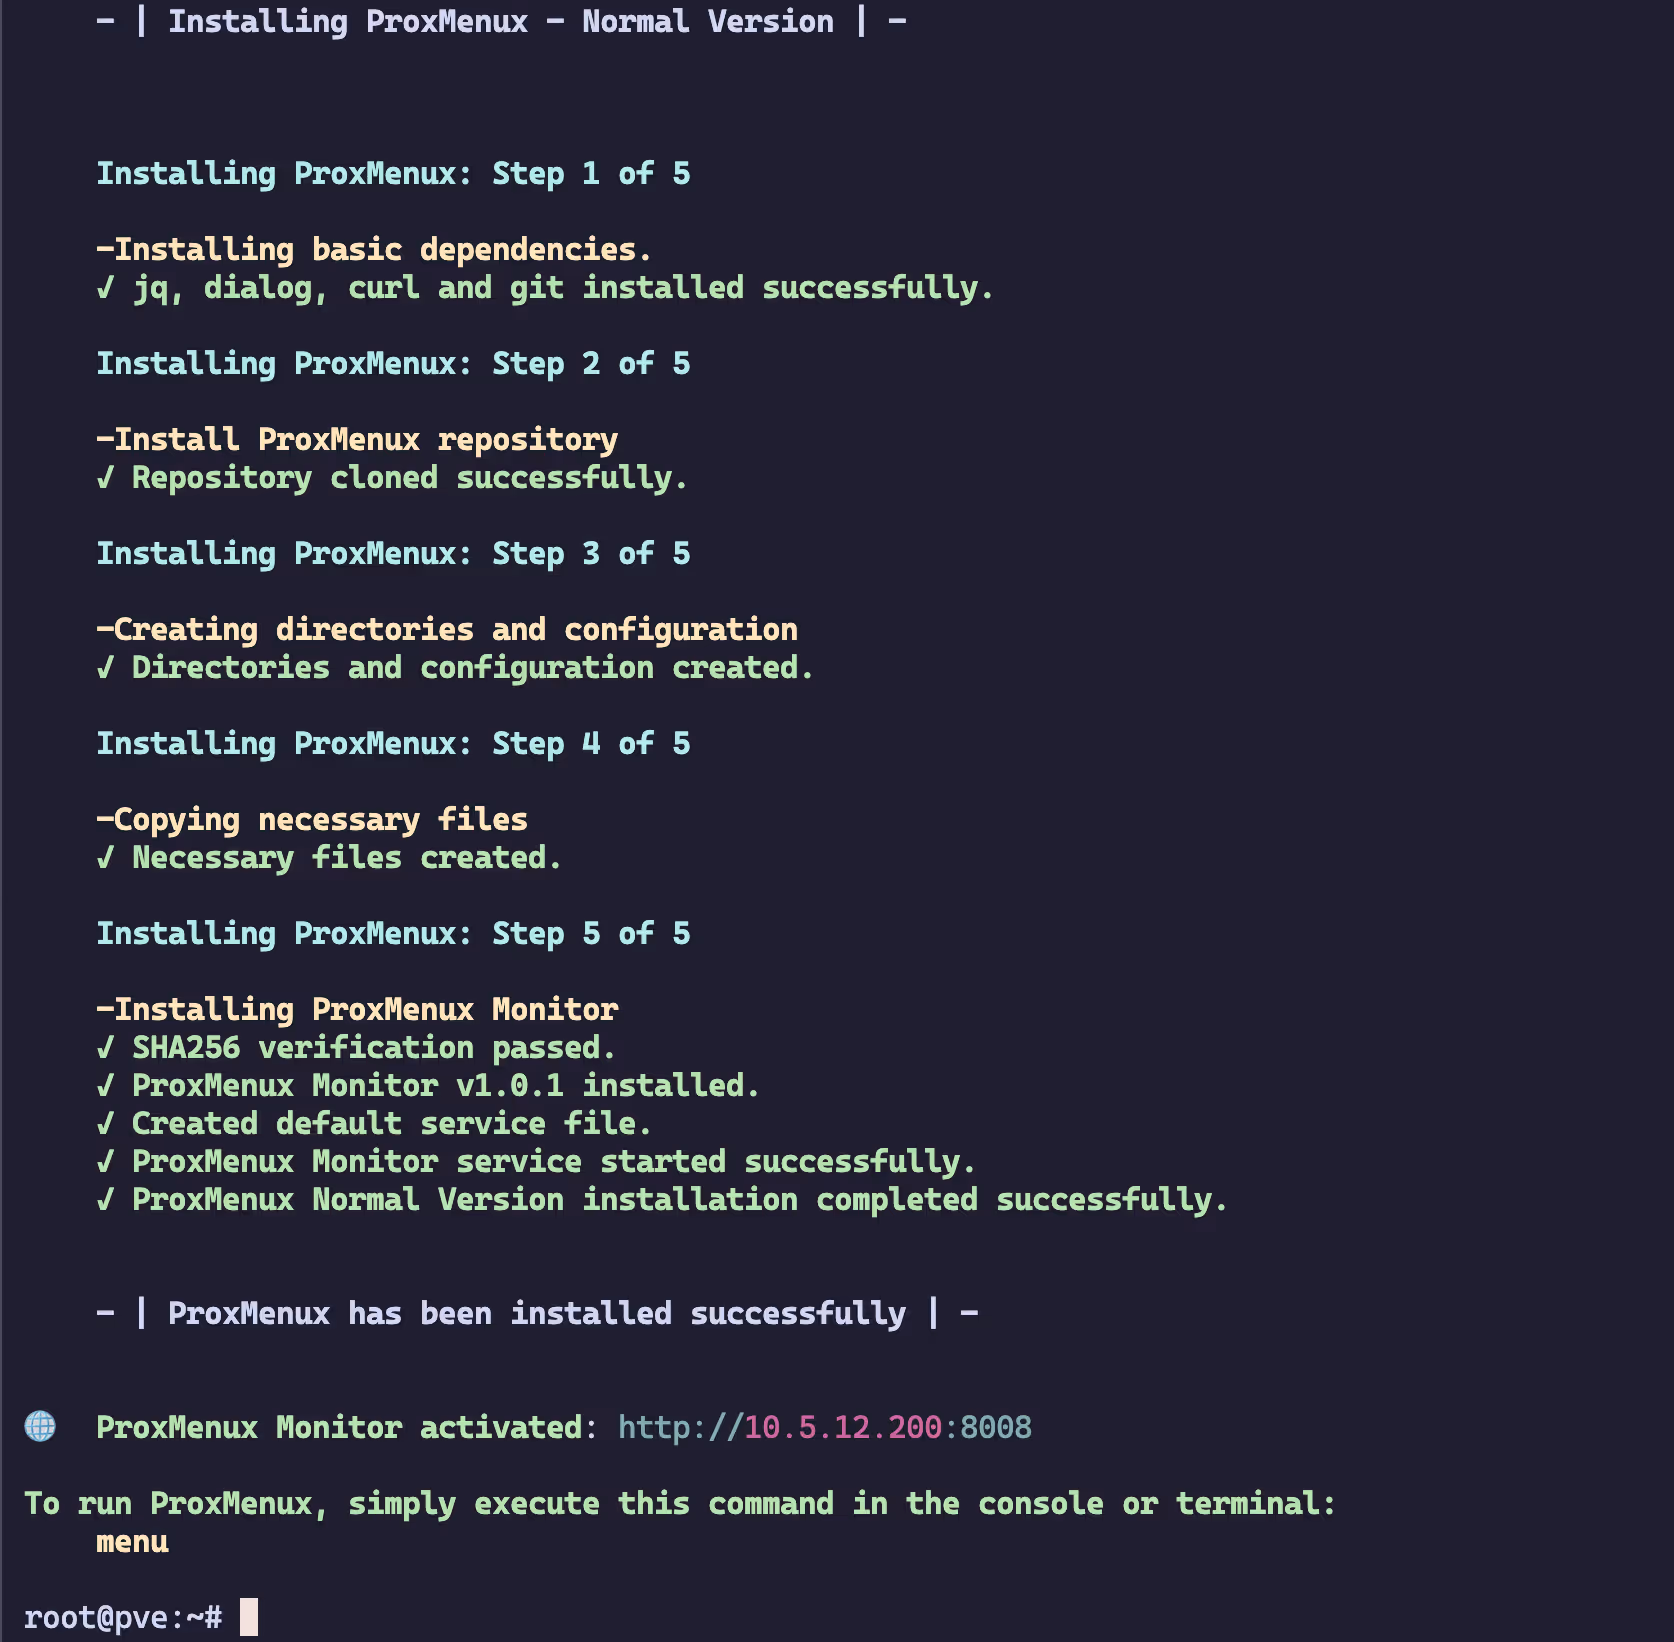
After selecting “yes” to continue, the script will print messages as each installation stage completes successfully. Once done, you’ll see that ProxMenux Monitor is active. At this point, you can type menu to launch the menu-driven ProxMenux tool, or open port 8008 in your web browser.
Login
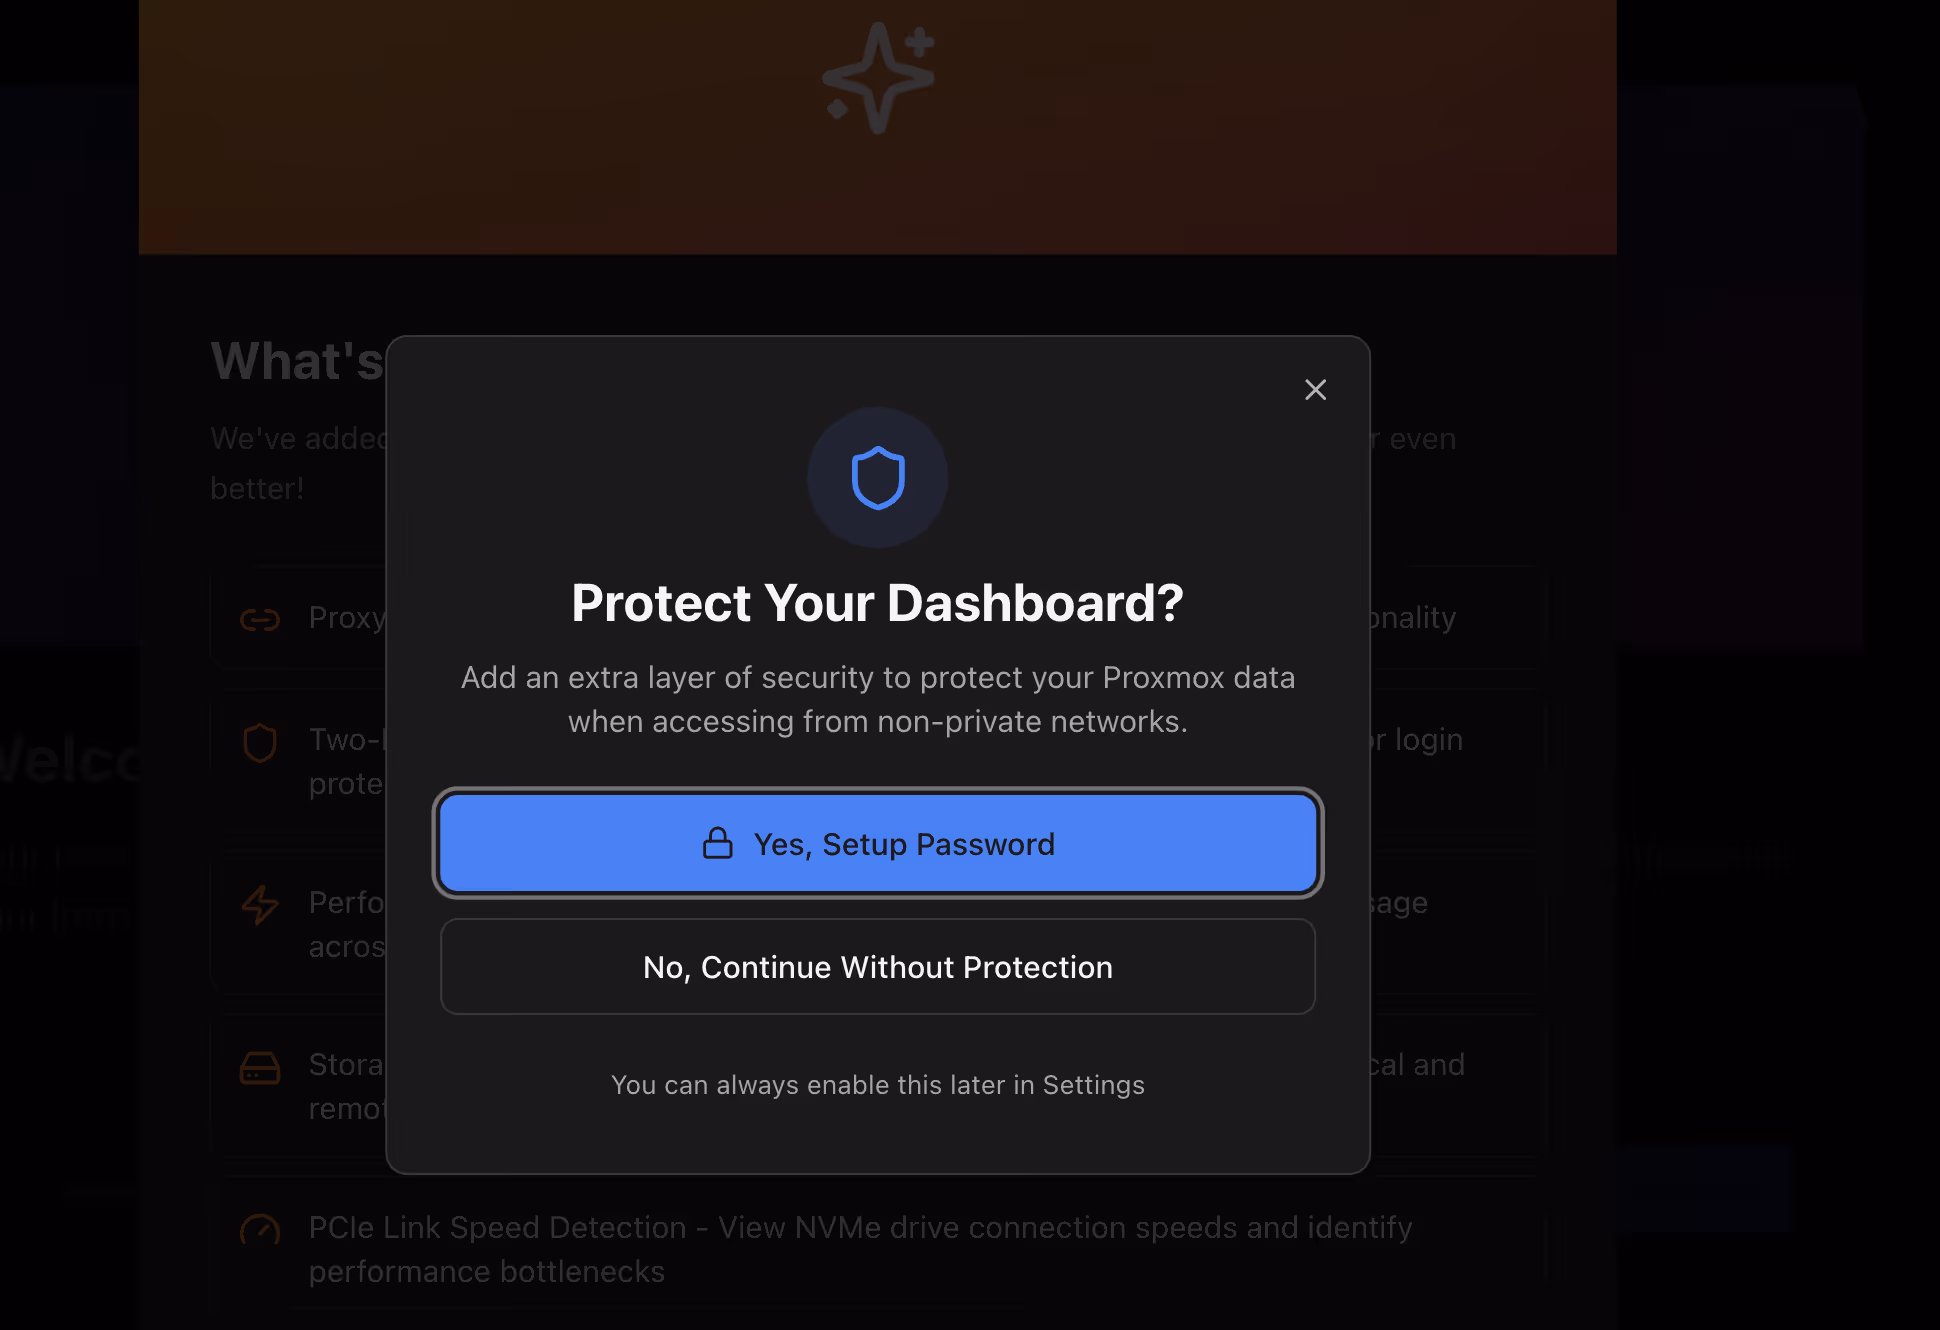
Open port 8008 in your browser, set your account password, and then sign in.
Page Overview
Home


Storage Page


Network Page
VM List
System Page
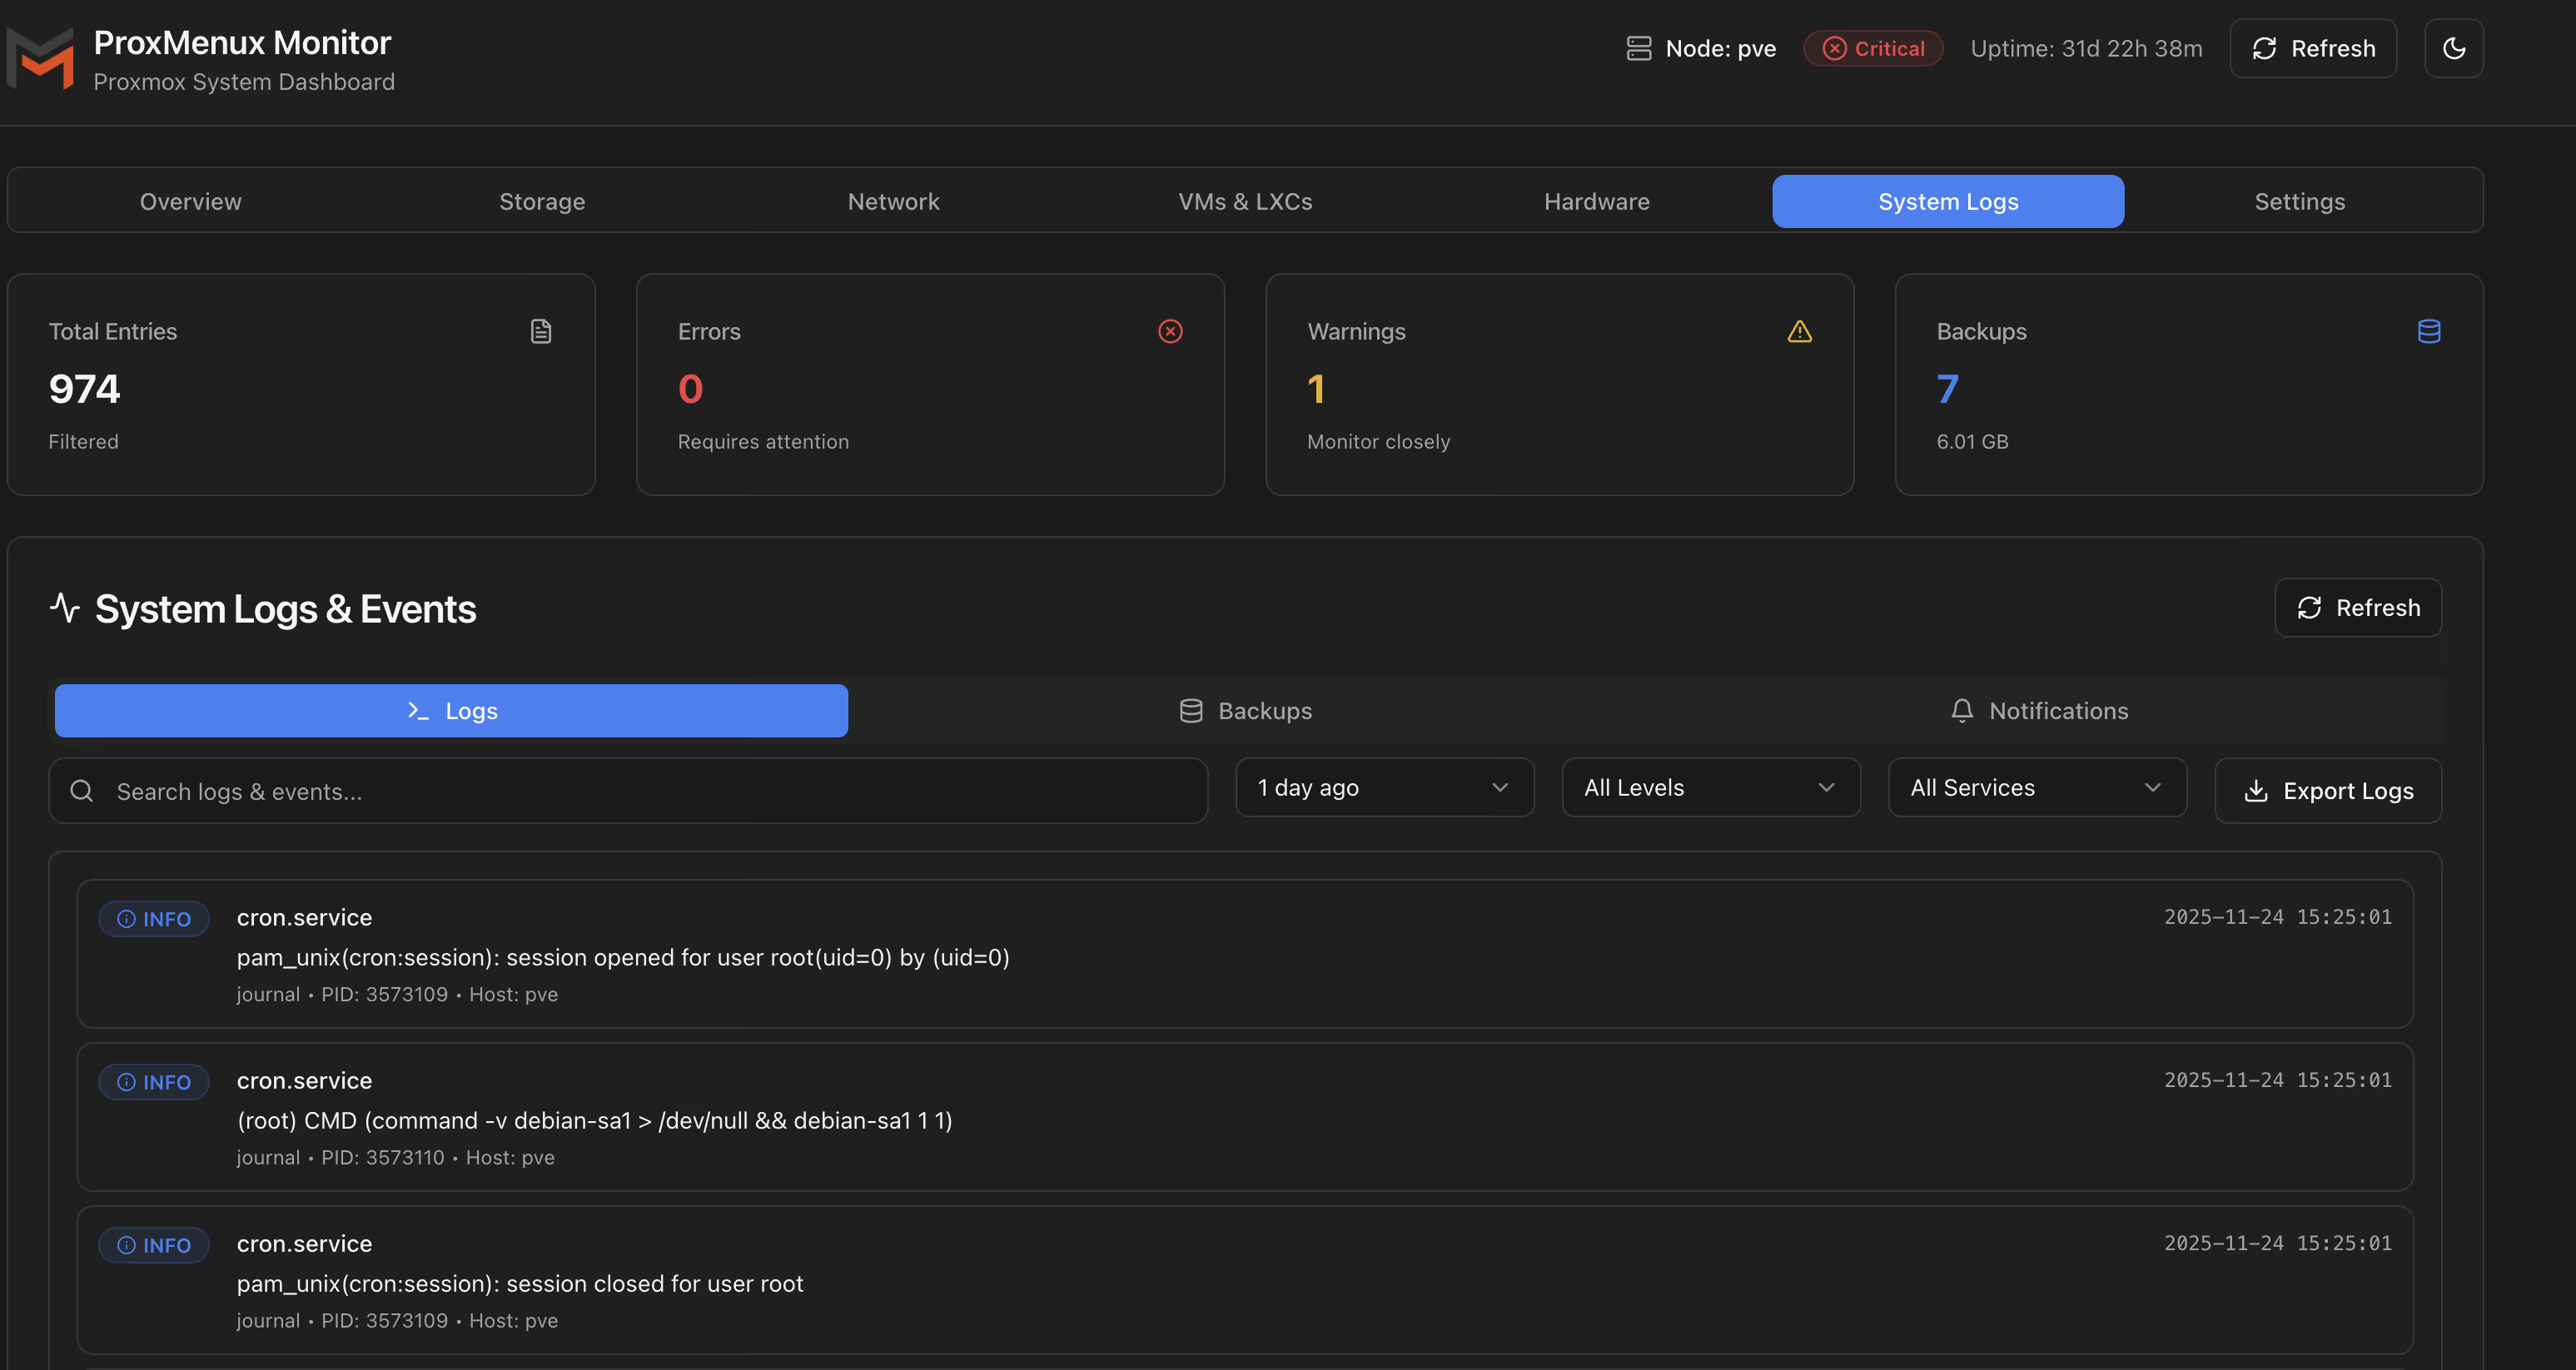
Logs Page
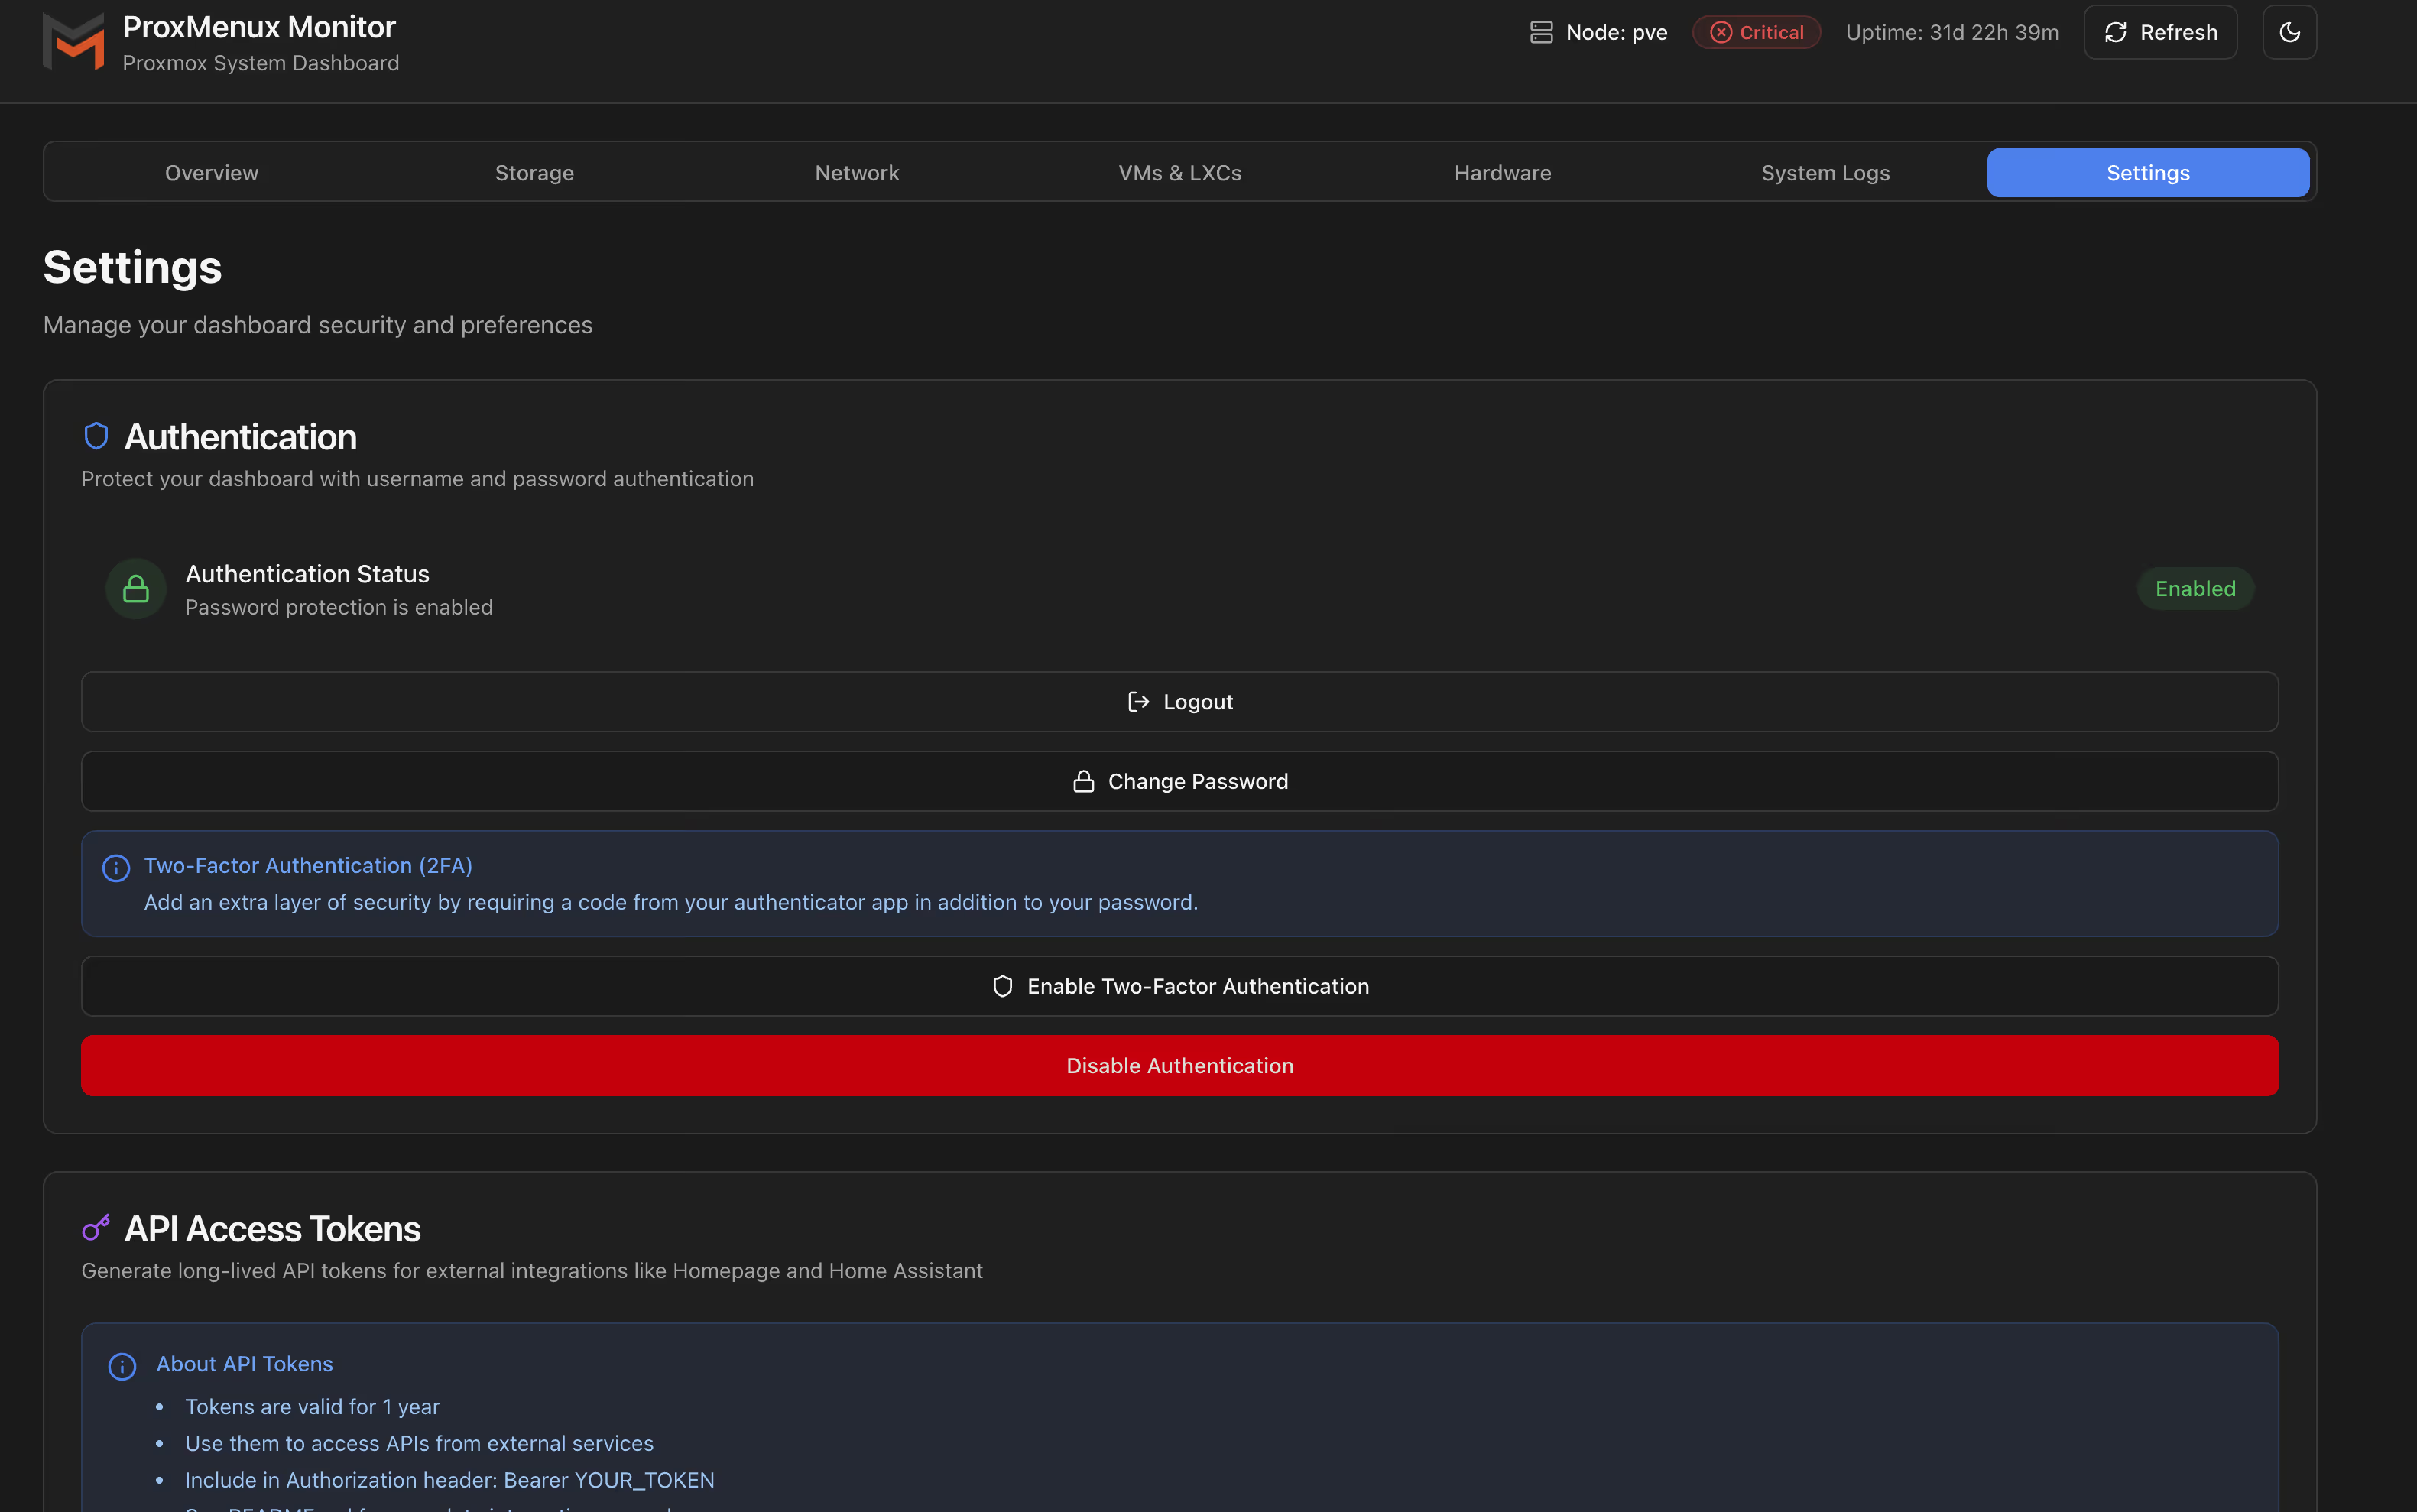
Settings Page
Summary
This is a very handy and visually polished monitoring dashboard. At the moment, it appears to lack alert/notification features. It’s best suited for single-node PVE setups; for multi-node PVE environments, you should still rely on other monitoring tools such as Pulse, Grafana, or Prometheus.