Building Network Quality Monitoring with Smokeping, Prometheus, and Grafana
2. Environment Preparation
| Component | Version |
|---|---|
| OS | Debian GNU/Linux 12 (bookworm) |
Smokeping Deployment
Smokeping is an open-source tool for monitoring network status and stability (developed by the author of rrdtool). Smokeping sends various types of test packets to target devices and systems, measures and records the results, and visualizes network latency using rrdtool-based charts. This makes it easy to understand the real-time state of network communication, such as latency, packet loss rate, and whether the connection is multi-line BGP.
Components Overview
general (general settings), alerts (alert settings), Database (database parameters), presentation (custom network views), slaves (Smokeping slaves), targets (target configuration — including probe/plugin definitions)
Docker Deployment
docker pull linuxserver/smokepingdocker run -d \--name=smokeping \-e TZ=Asia/Shanghai \-p 9080:80 \-v /home/config/smokeping:/config \-v /home/data/smokeping:/data \--restart unless-stopped \linuxserver/smokepingDeploy the Push Script
apt update && apt upgradeapt install -y rrdtoolcd /home/config/smokeping/git clone https://github.com/Sayyiku/idc_ping_monitor.gitunzip idc_ping_monitor-master.zip(如果是因为网络上传,需要用到此命令解压)mv idc_ping_monitor-master/smokeping/location/ /home/config/smokeping/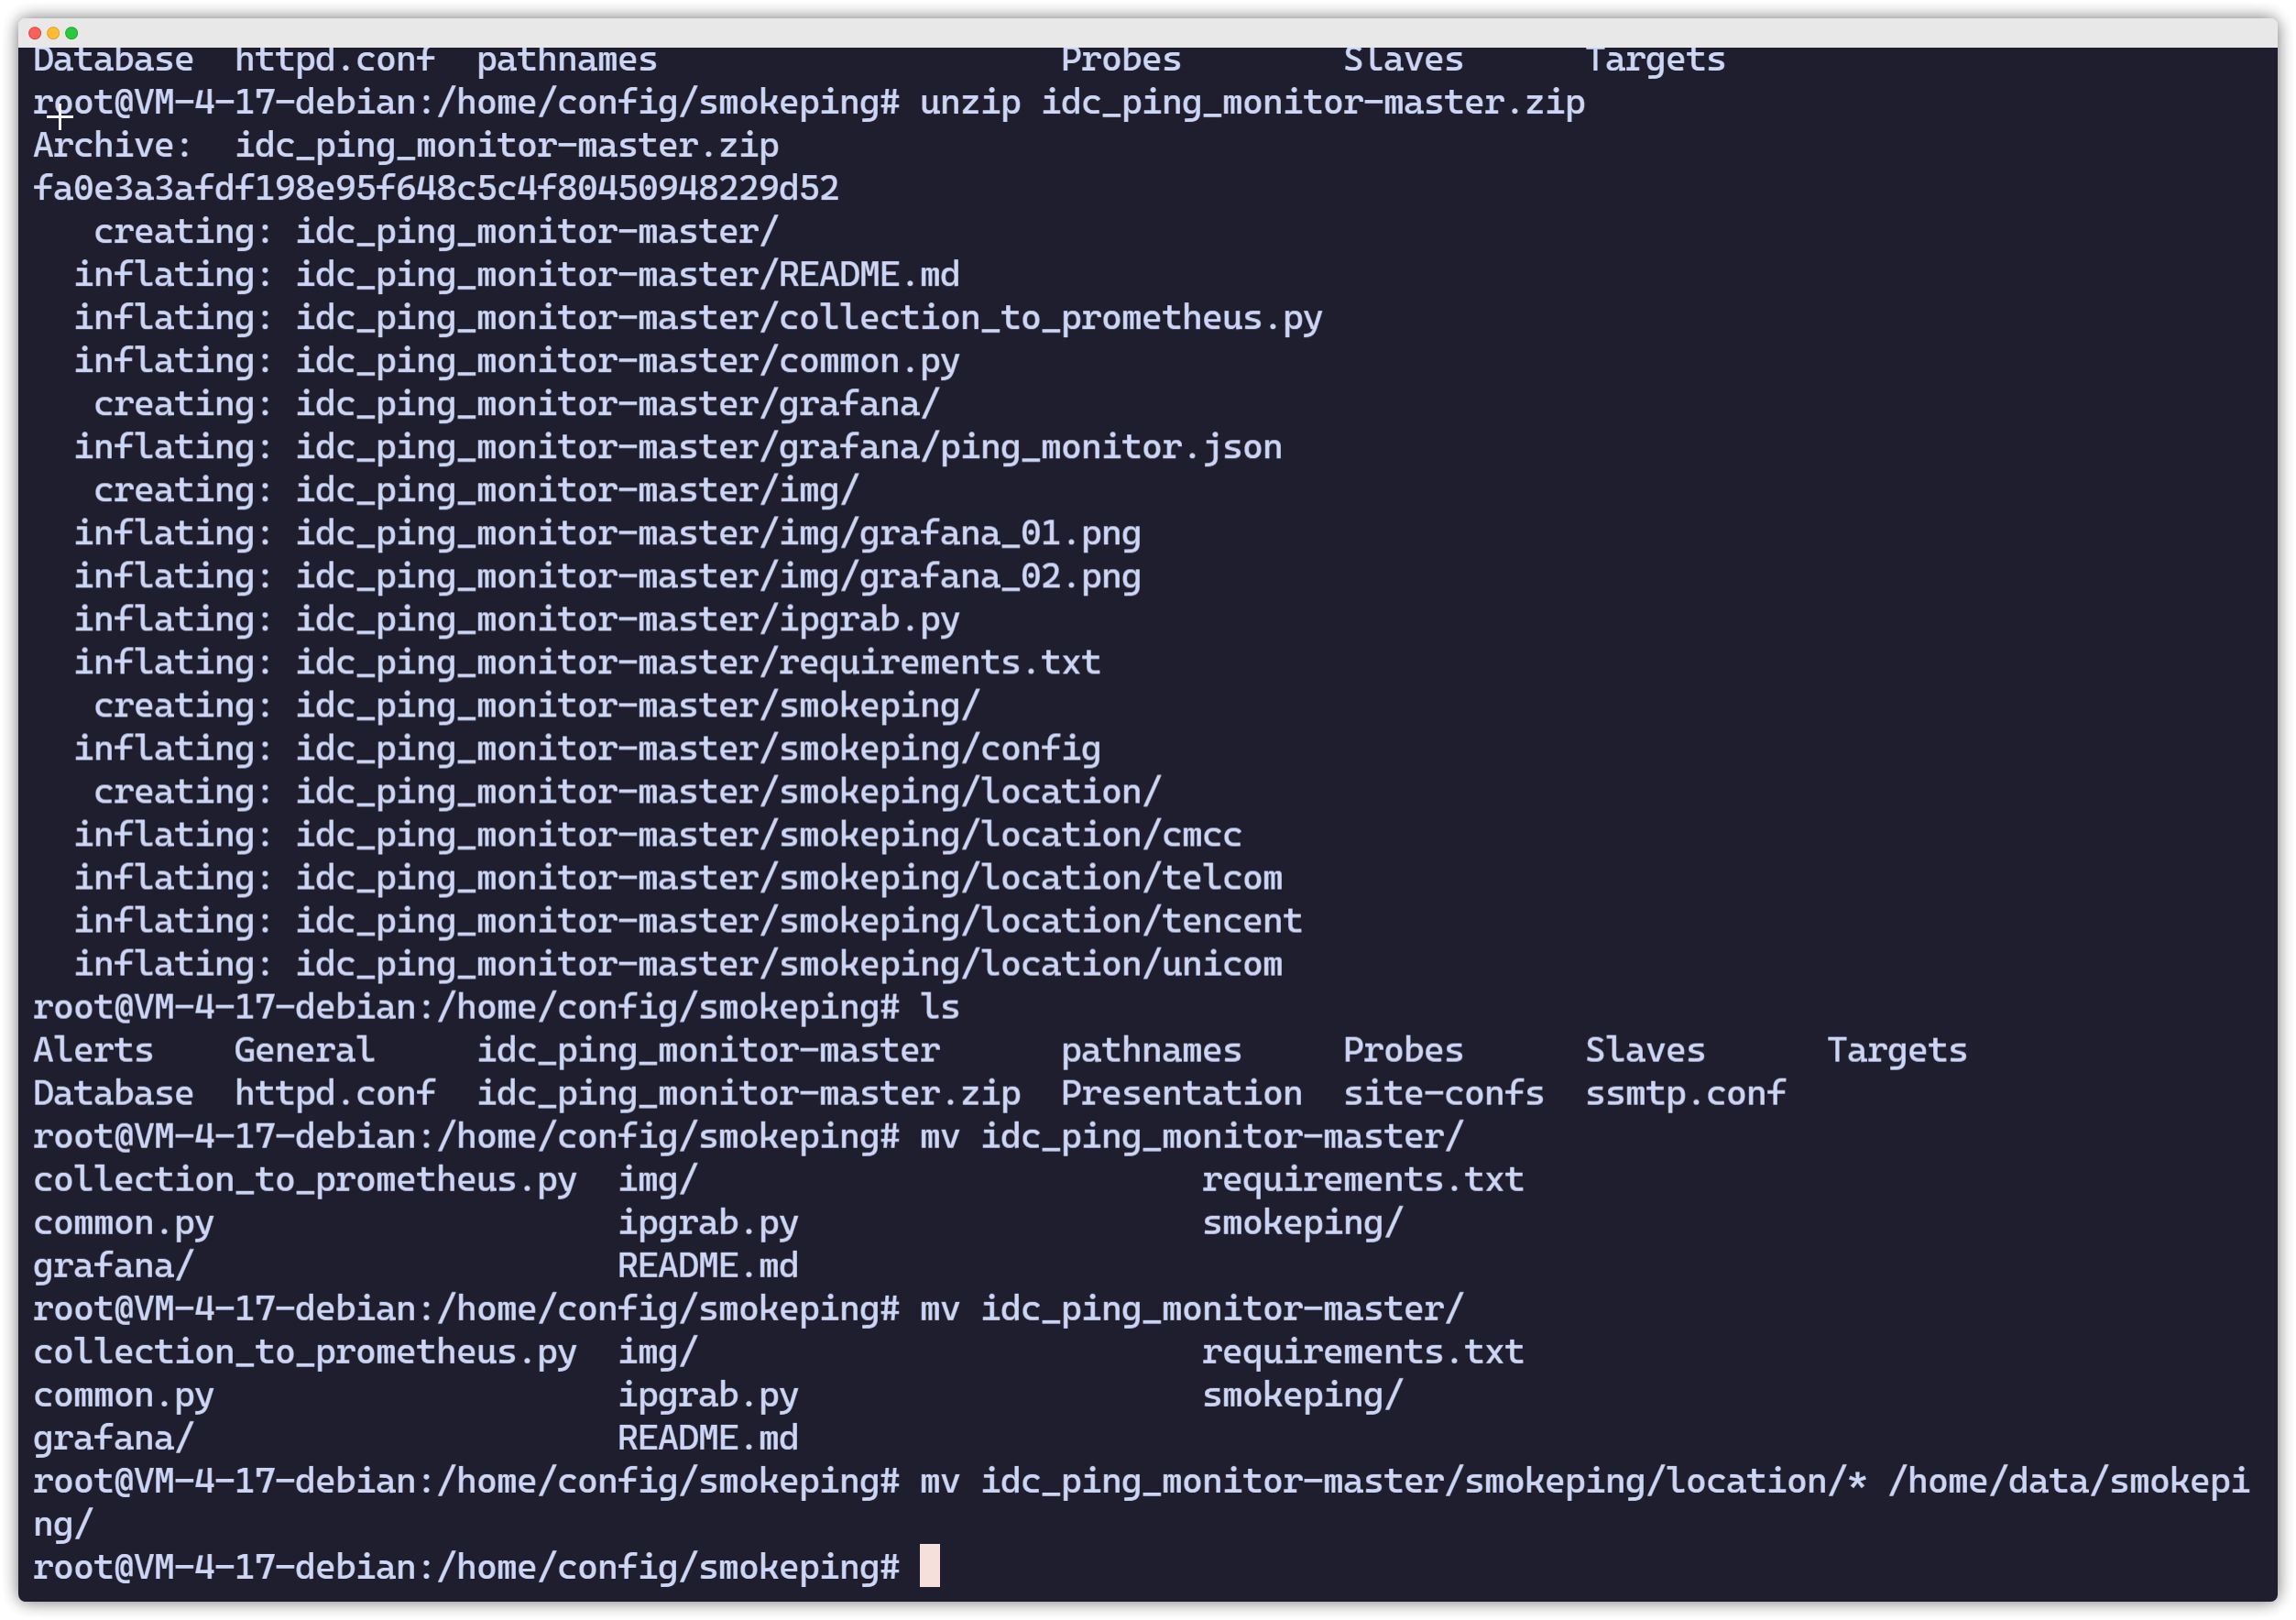
Edit Smokeping Monitoring Configuration
vim Targets*** Targets ***
probe = FPing
menu = Toptitle = 网络节点质量监控remark = Smokeping 网络质量监控系统
@include /config/location/cmcc@include /config/location/telcom@include /config/location/tencent@include /config/location/unicomRefresh Smokeping
find /home/data/smokeping/ -name "*.rrd"|xargs rm -fdocker restart 容器 ID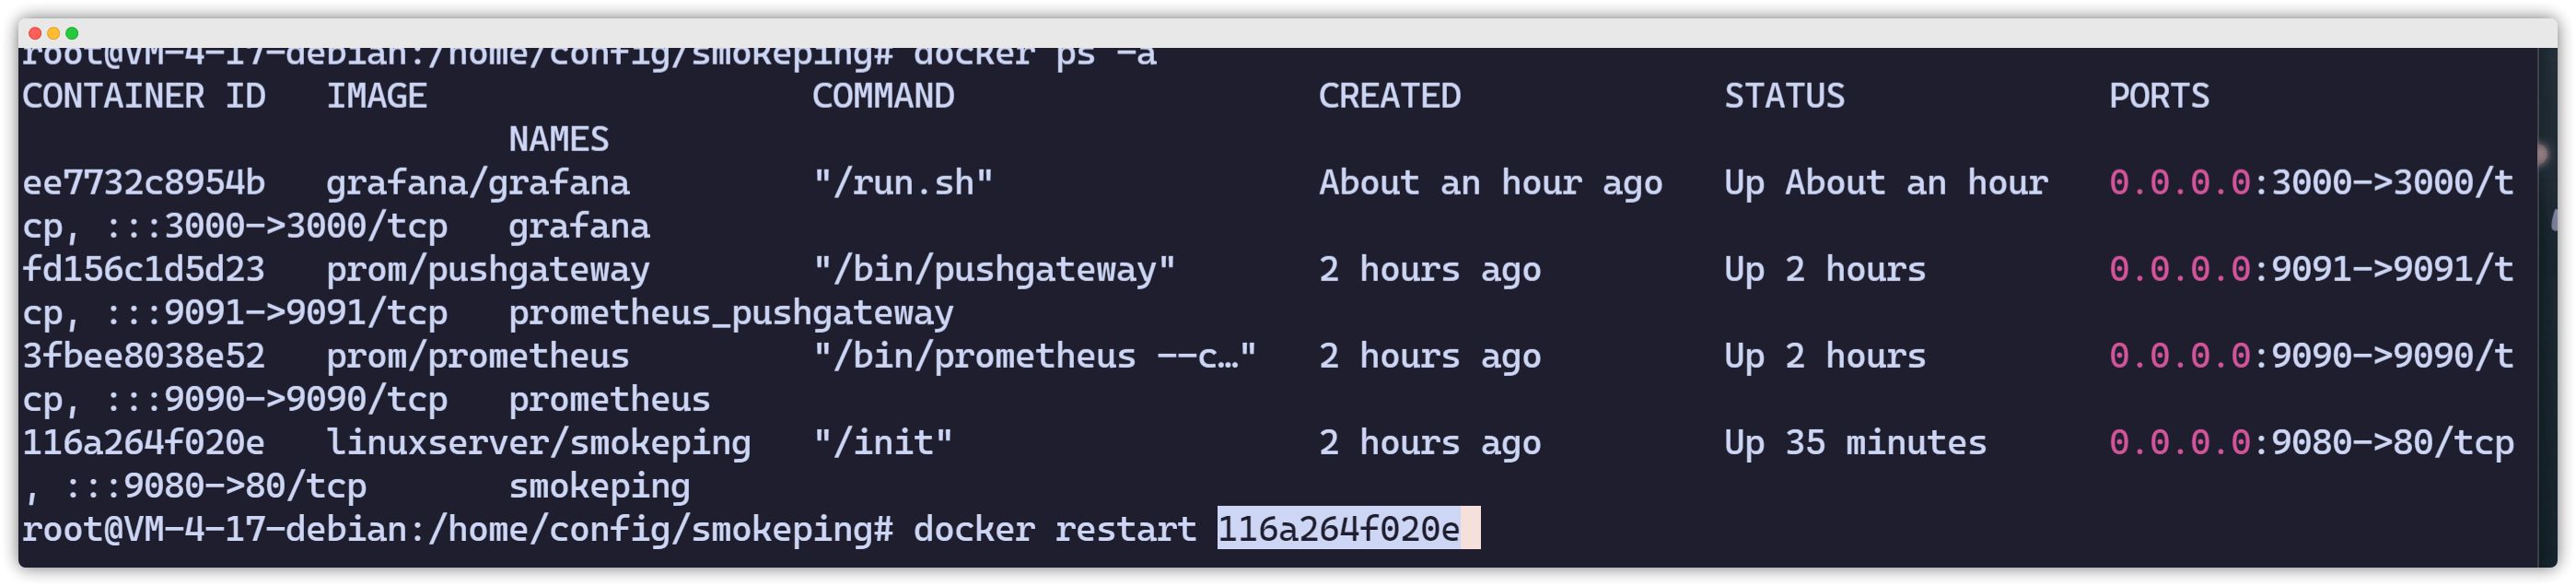
Modify the Script
Change IP to the local host IP.
root@VM-4-17-debian:/home/config/smokeping# vim /home/config/smokeping/idc_ping_monitor-master/collection_to_prometheus.py
'LOG_FILE' : '/tmp/smoking_pushgateway.log','prometheus_gateway' : 'http://ip:9091','data_dir' : '/home/data/smokeping'Configure a Cron Job
crontab -e* * * * * python3 /home/config/smokeping/idc_ping_monitor-master/collection_to_prometheus.pyPrometheus Deployment
Introduction to Time Series Data
A time series database focuses on time as the primary axis and records how things change as time passes. A relational database mainly describes relationships between entities, such as one-to-many or many-to-many, and these relationships are relatively complex compared to time. Time is simpler: you only need to record what changed for a given entity at a specific point in time. Monitoring data fits this pattern very well: we simply record how a metric changes as time goes by.
Time series databases are particularly suitable for handling “change”. In a relational database, relationships are represented using table schemas. Once a schema is defined, data is continuously collected according to that schema. If something changes—such as adding a new metric dimension—you must modify the schema. DDL operations are costly for relational databases. Time series databases do not have this problem: time series datasets track system changes by continuously inserting new data instead of updating existing records. Therefore, for monitoring data, collecting new metric dimensions does not affect any overall “schema”—there effectively is no rigid table schema to modify.
Deploy Prometheus in a Container
root@VM-4-17-debian:~# docker run -d -p 9090:9090 --name prometheus prom/prometheusroot@VM-4-17-debian:~# docker cp prometheus:/etc/prometheus/prometheus.yml ./Persistent Deployment
root@VM-4-17-debian:~# docker rm -f prometheusprometheusroot@VM-4-17-debian:~# mkdir /data/prometheus/root@VM-4-17-debian:~# cp prometheus.yml /data/prometheus/root@VM-4-17-debian:~# docker run -d -p 9090:9090 --name prometheus \-v /data/prometheus/:/etc/prometheus/ \-e TZ="Asia/Shanghai" \-v /etc/localtime:/etc/localtime \prom/prometheus3fbee8038e5256c622dda73078bd5e04aea3c7abe9a2da62b61cf64541d0c50eroot@VM-4-17-debian:~#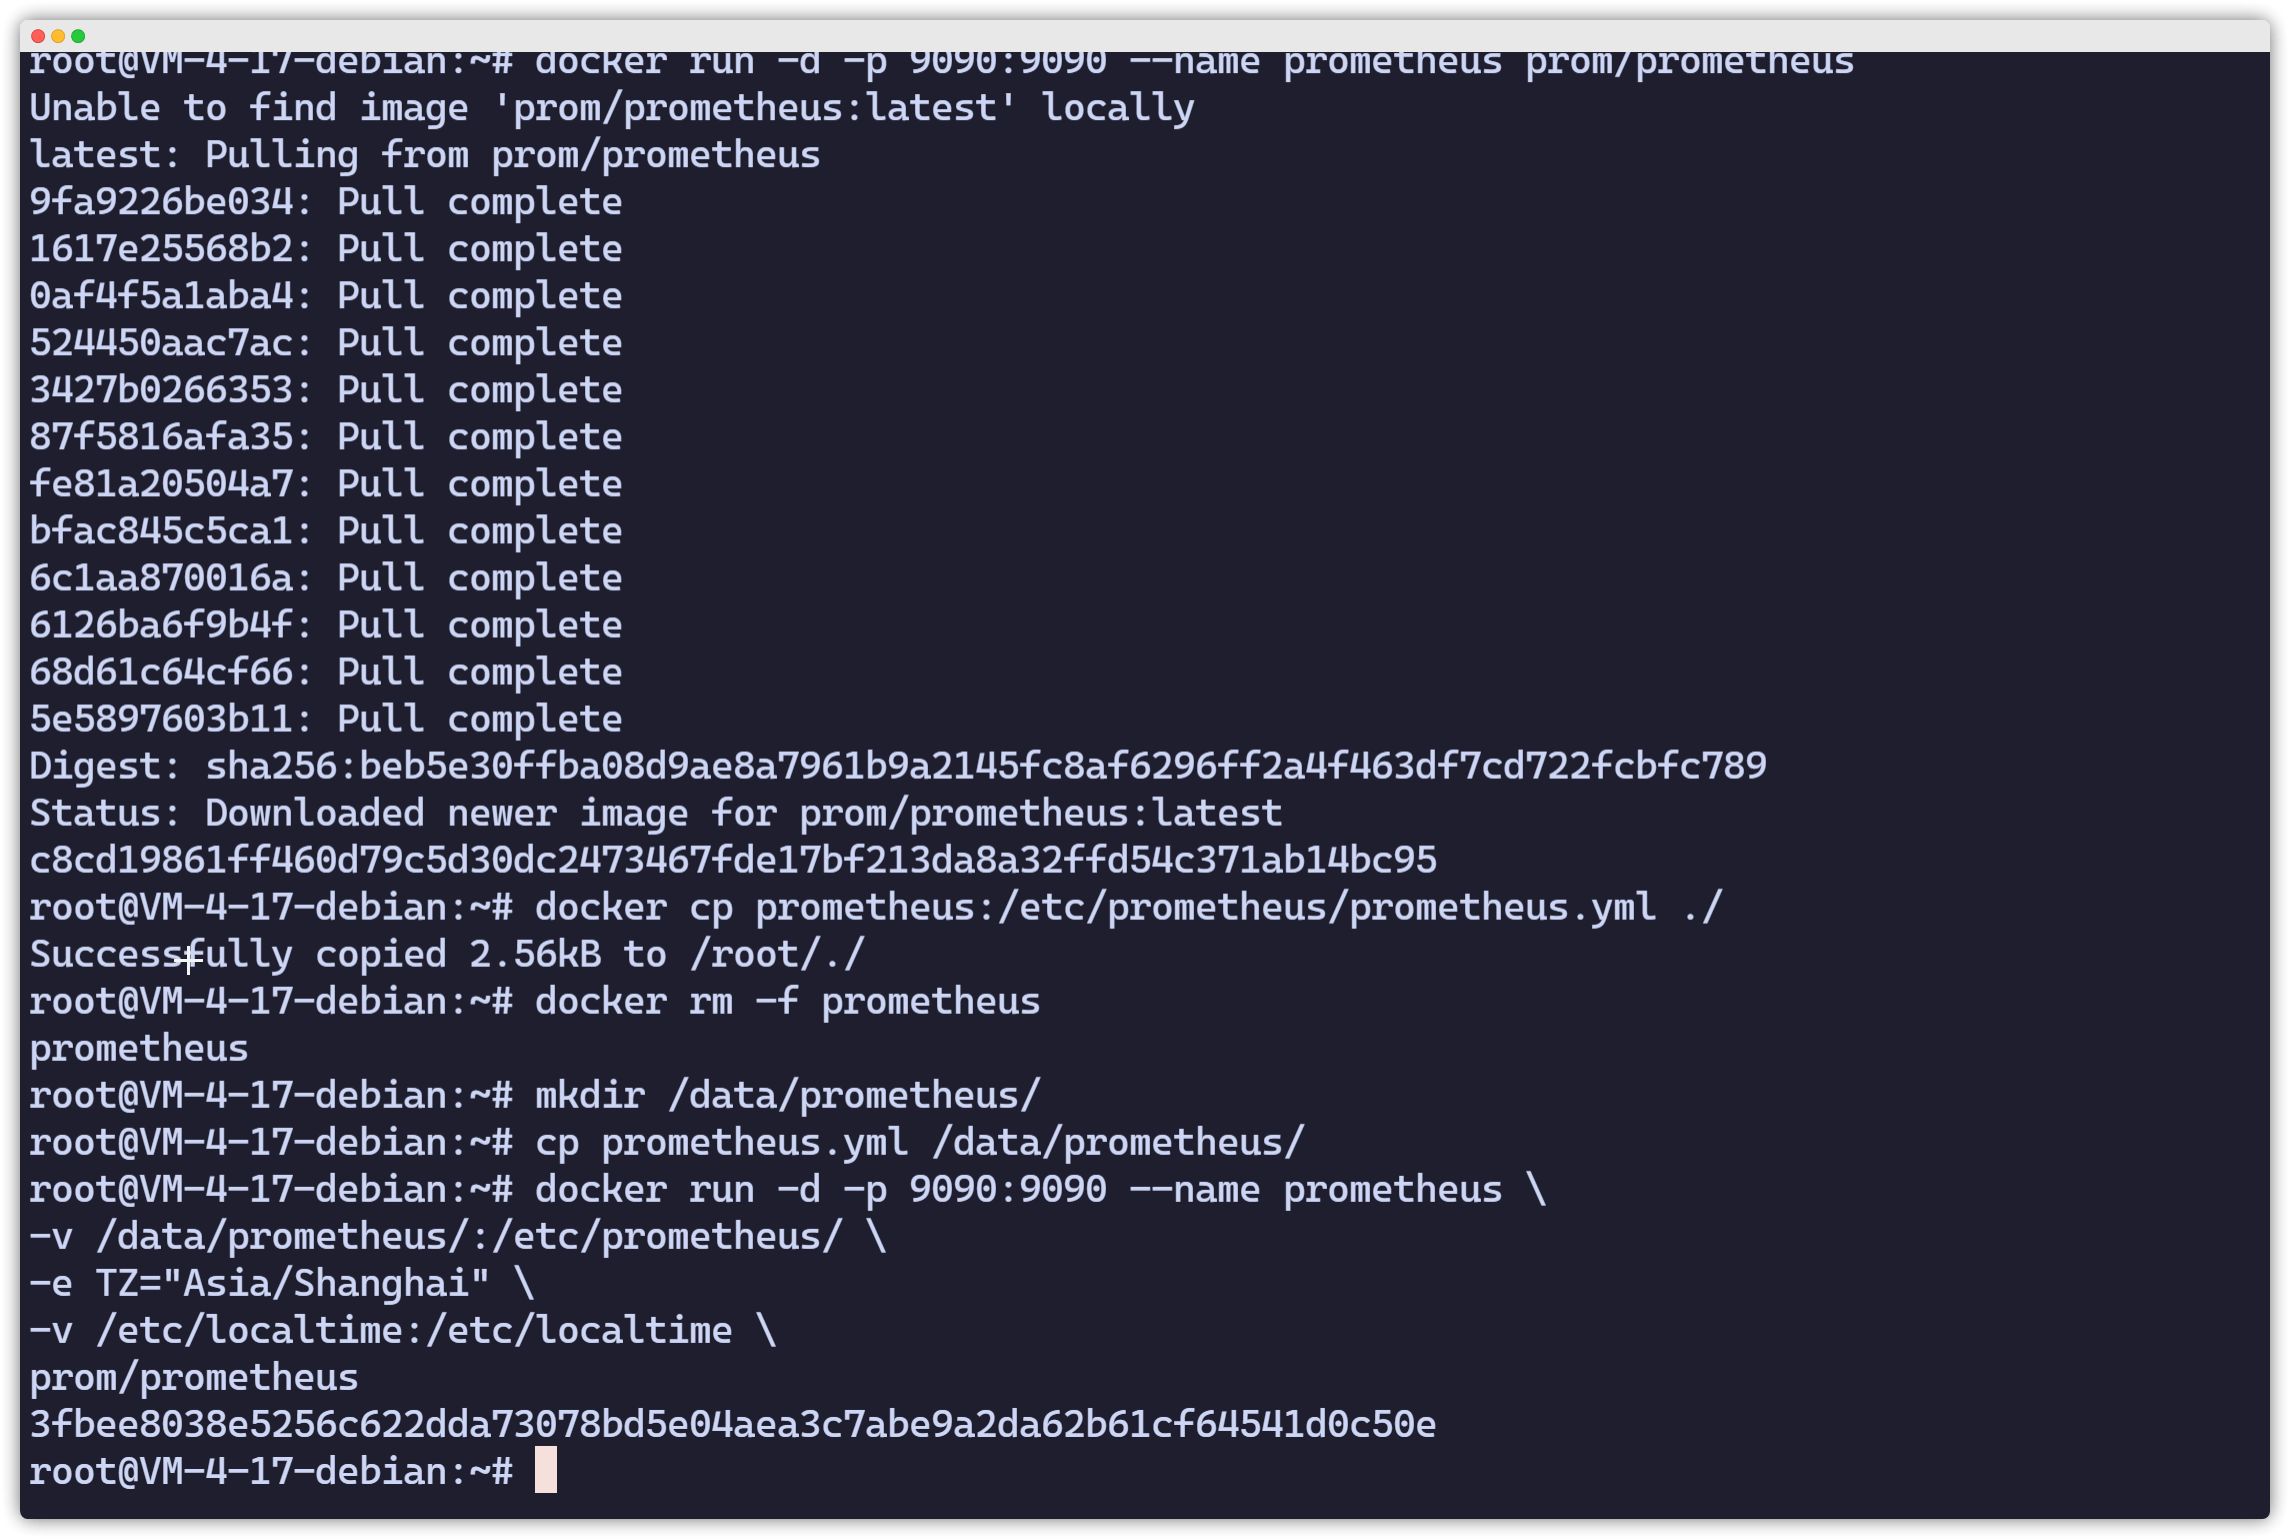
Prometheus Pushgateway Deployment
Docker Deployment
root@VM-4-17-debian:~# docker run -d --name="prometheus_pushgateway" -p 9091:9091 prom/pushgateway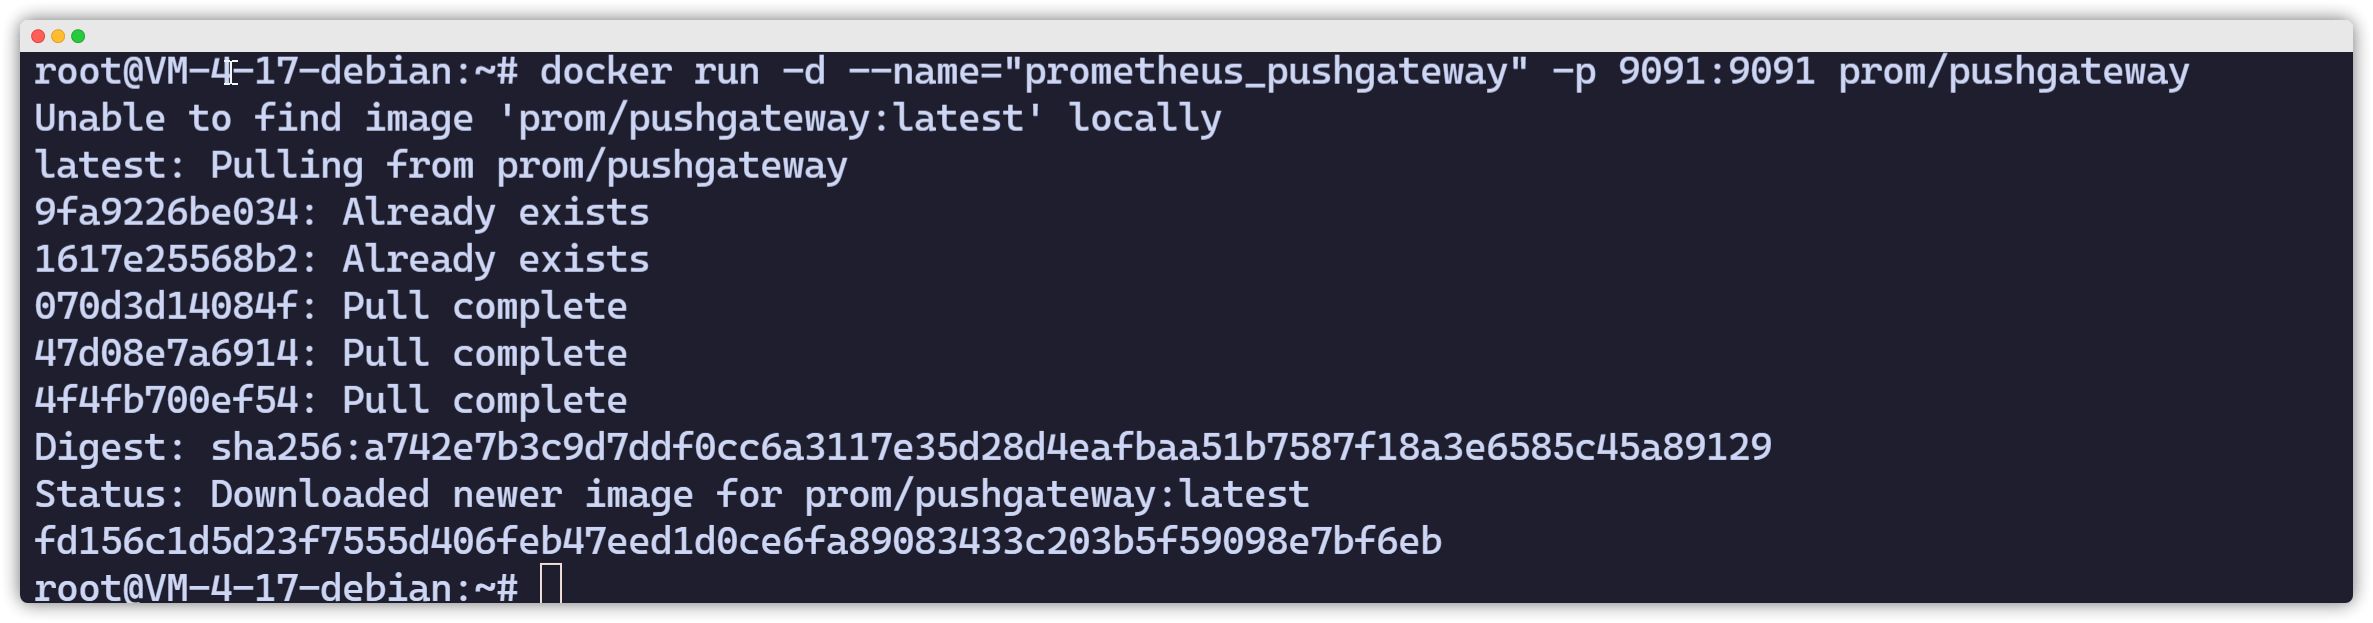
Modify Prometheus Configuration to Add Pushgateway
root@VM-4-17-debian:~# vim /data/prometheus/prometheus.yml - job_name: prometheus_pushgateway honor_labels: true # 避免收集数据本身的 job 和 instance被pushgateway实例信息覆盖 static_configs: - targets: ['ip:9091'] labels: instance: pushgatewayroot@VM-4-17-debian:~# docker restart prometheus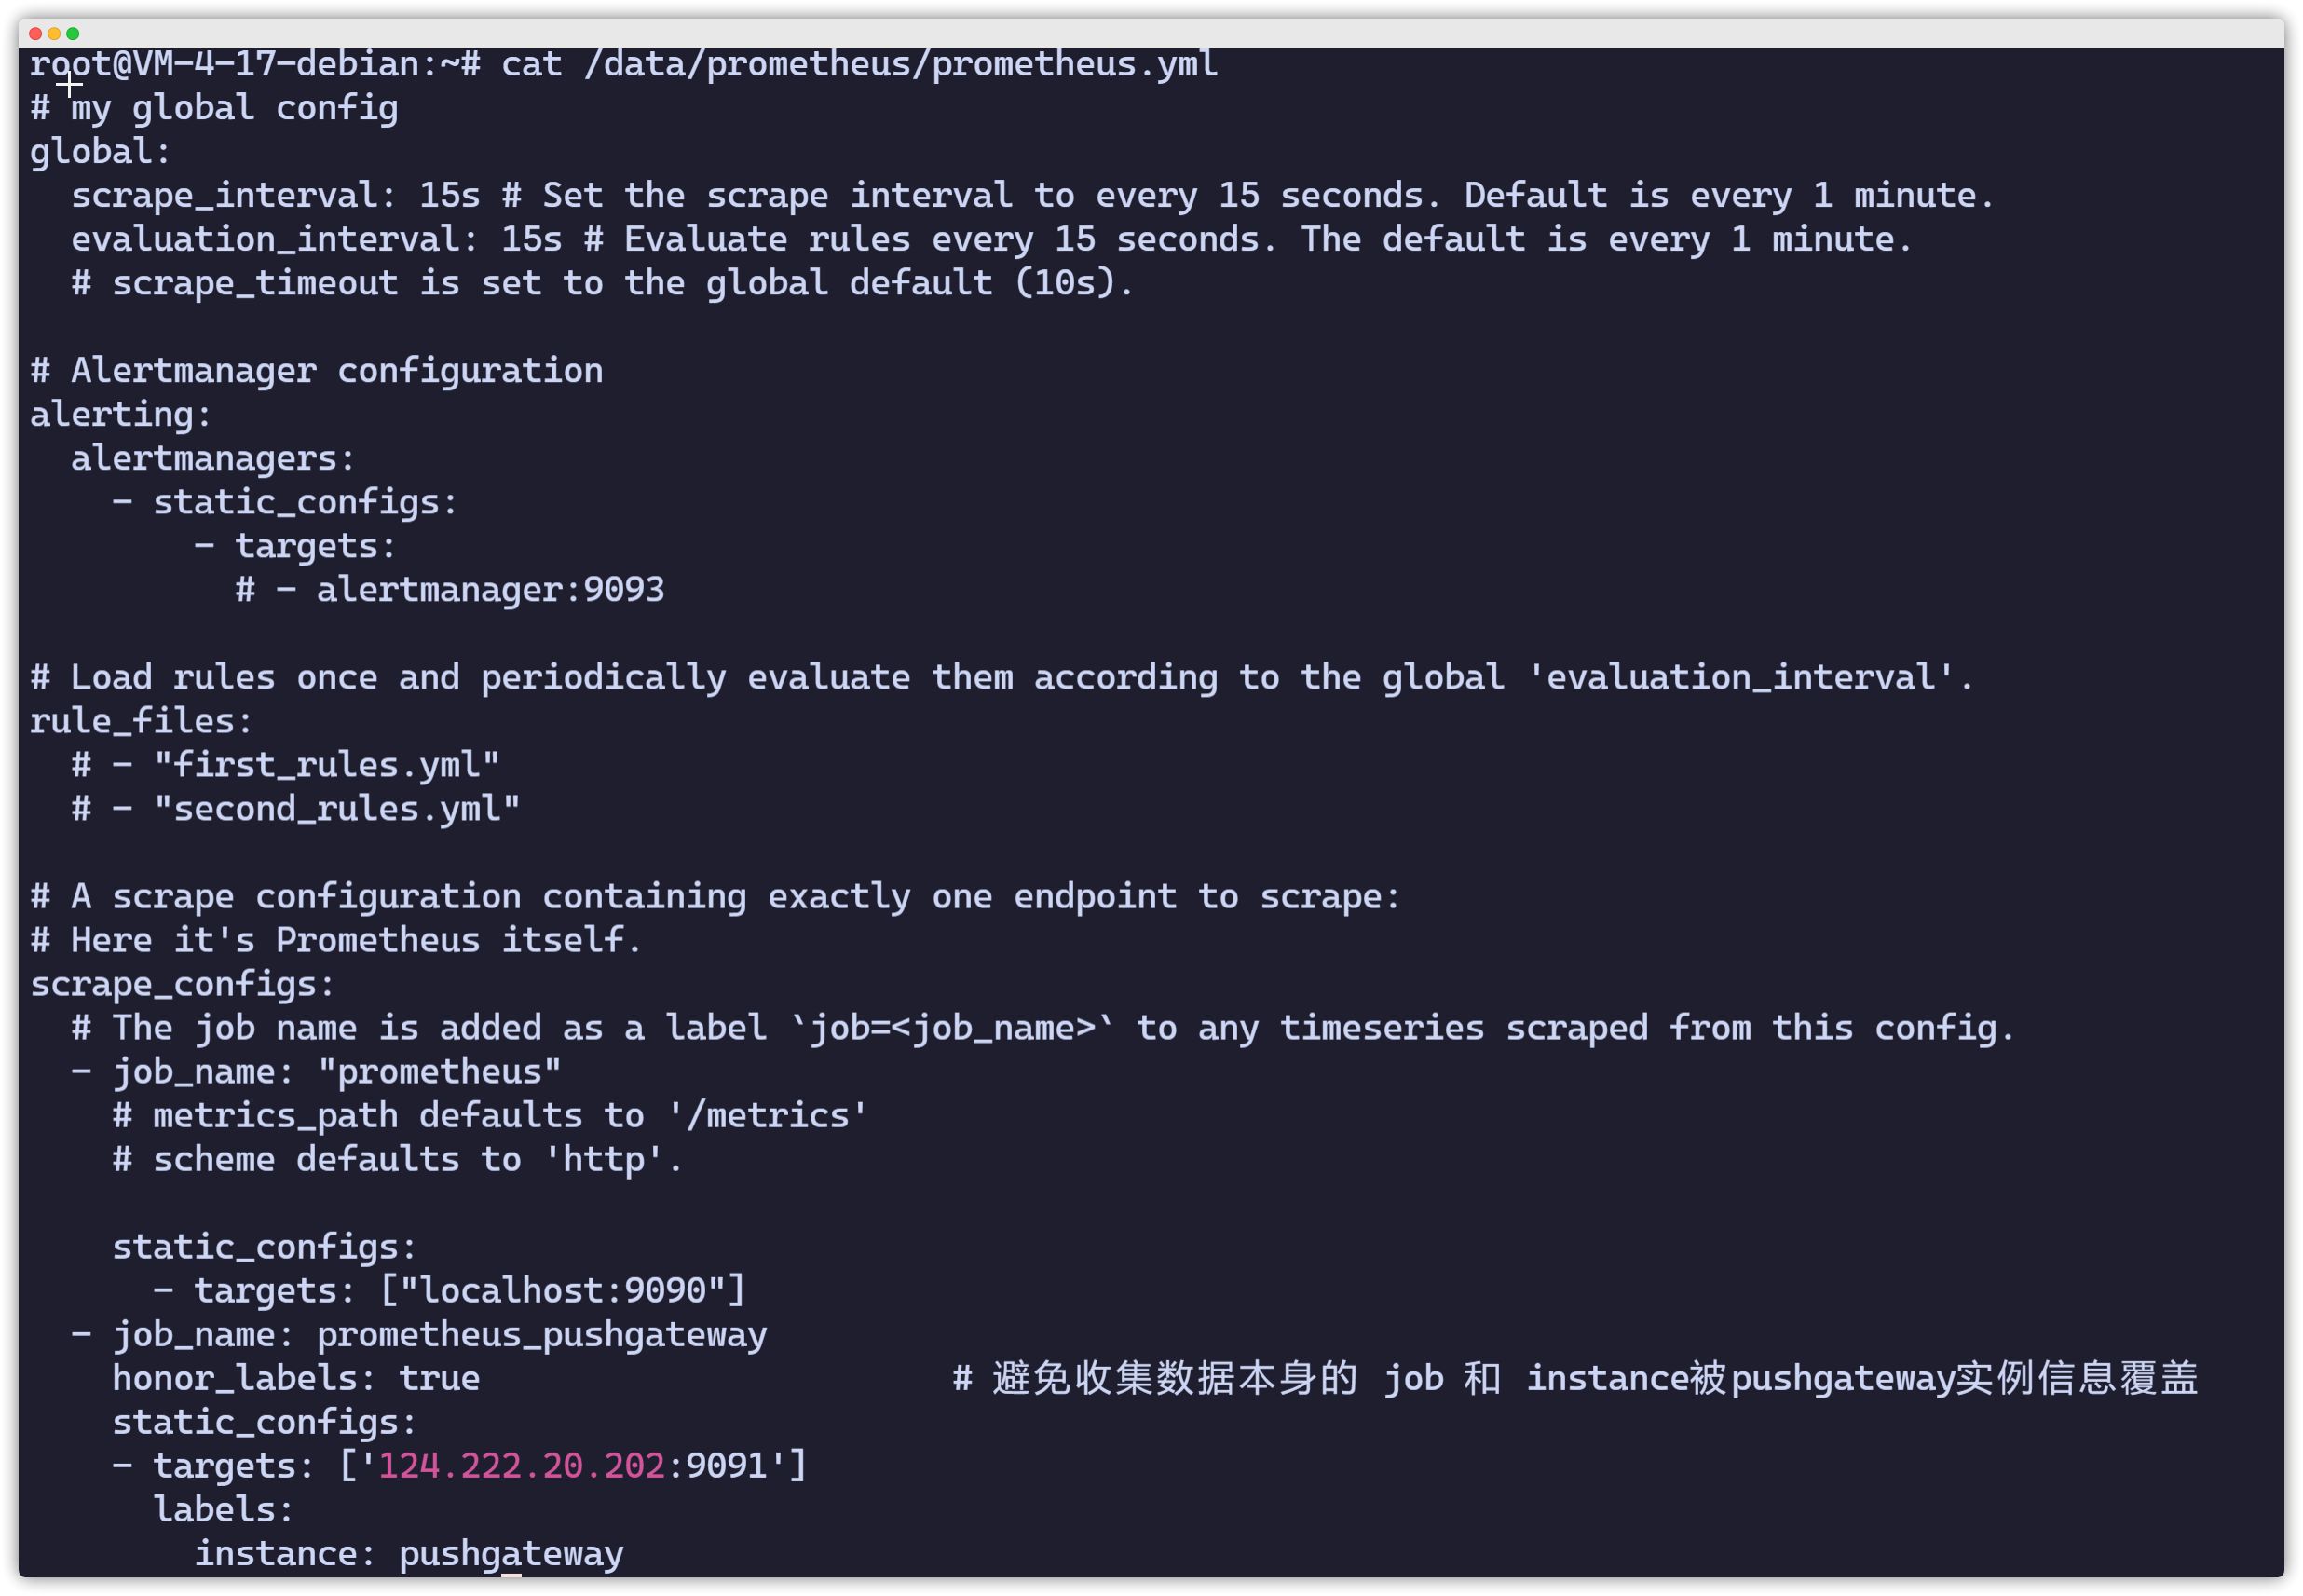
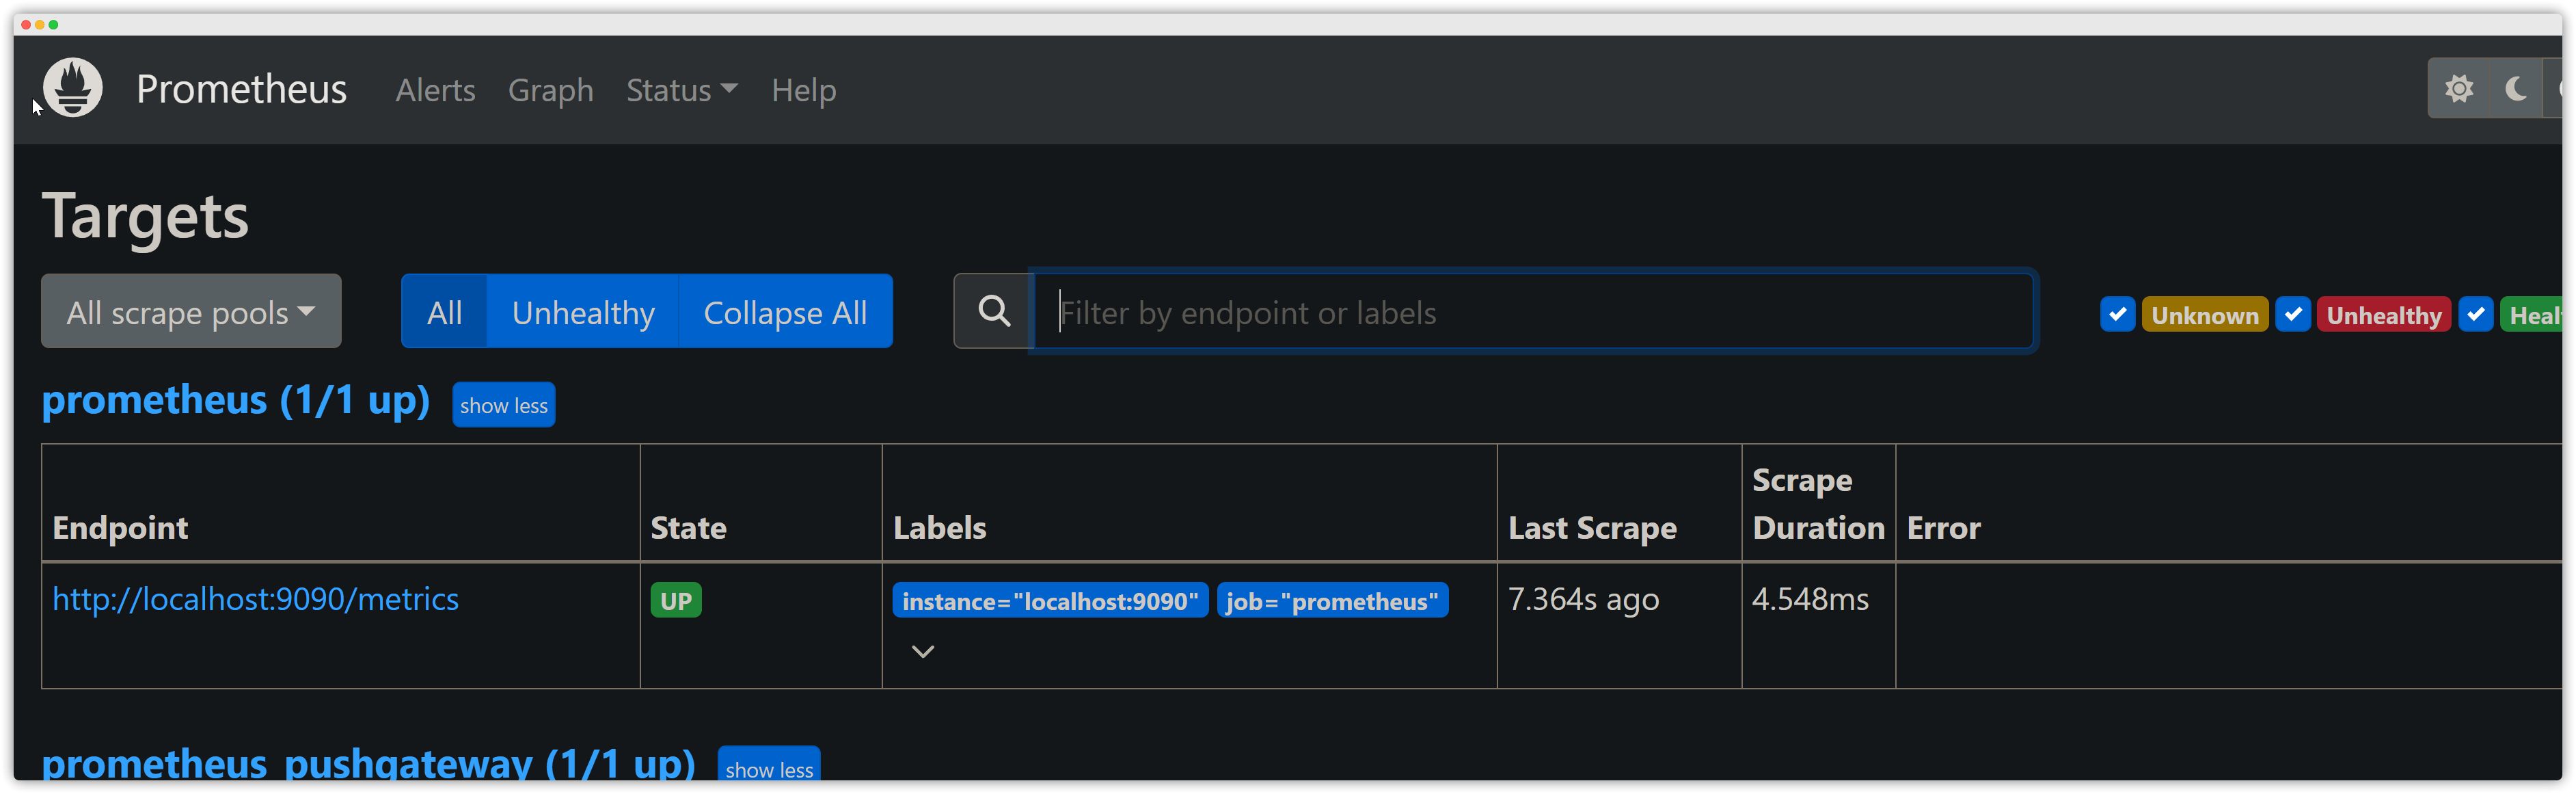
Prometheus Web (IP<9090>)
Check whether the Pushgateway status is UP.
Grafana Deployment
Official docs: https://grafana.com/docs/grafana/latest/
Docker Deployment
[root@VM-4-17-debian ~]# mkdir /data/grafana-storage[root@VM-4-17-debian ~]# chmod 777 /data/grafana-storage/
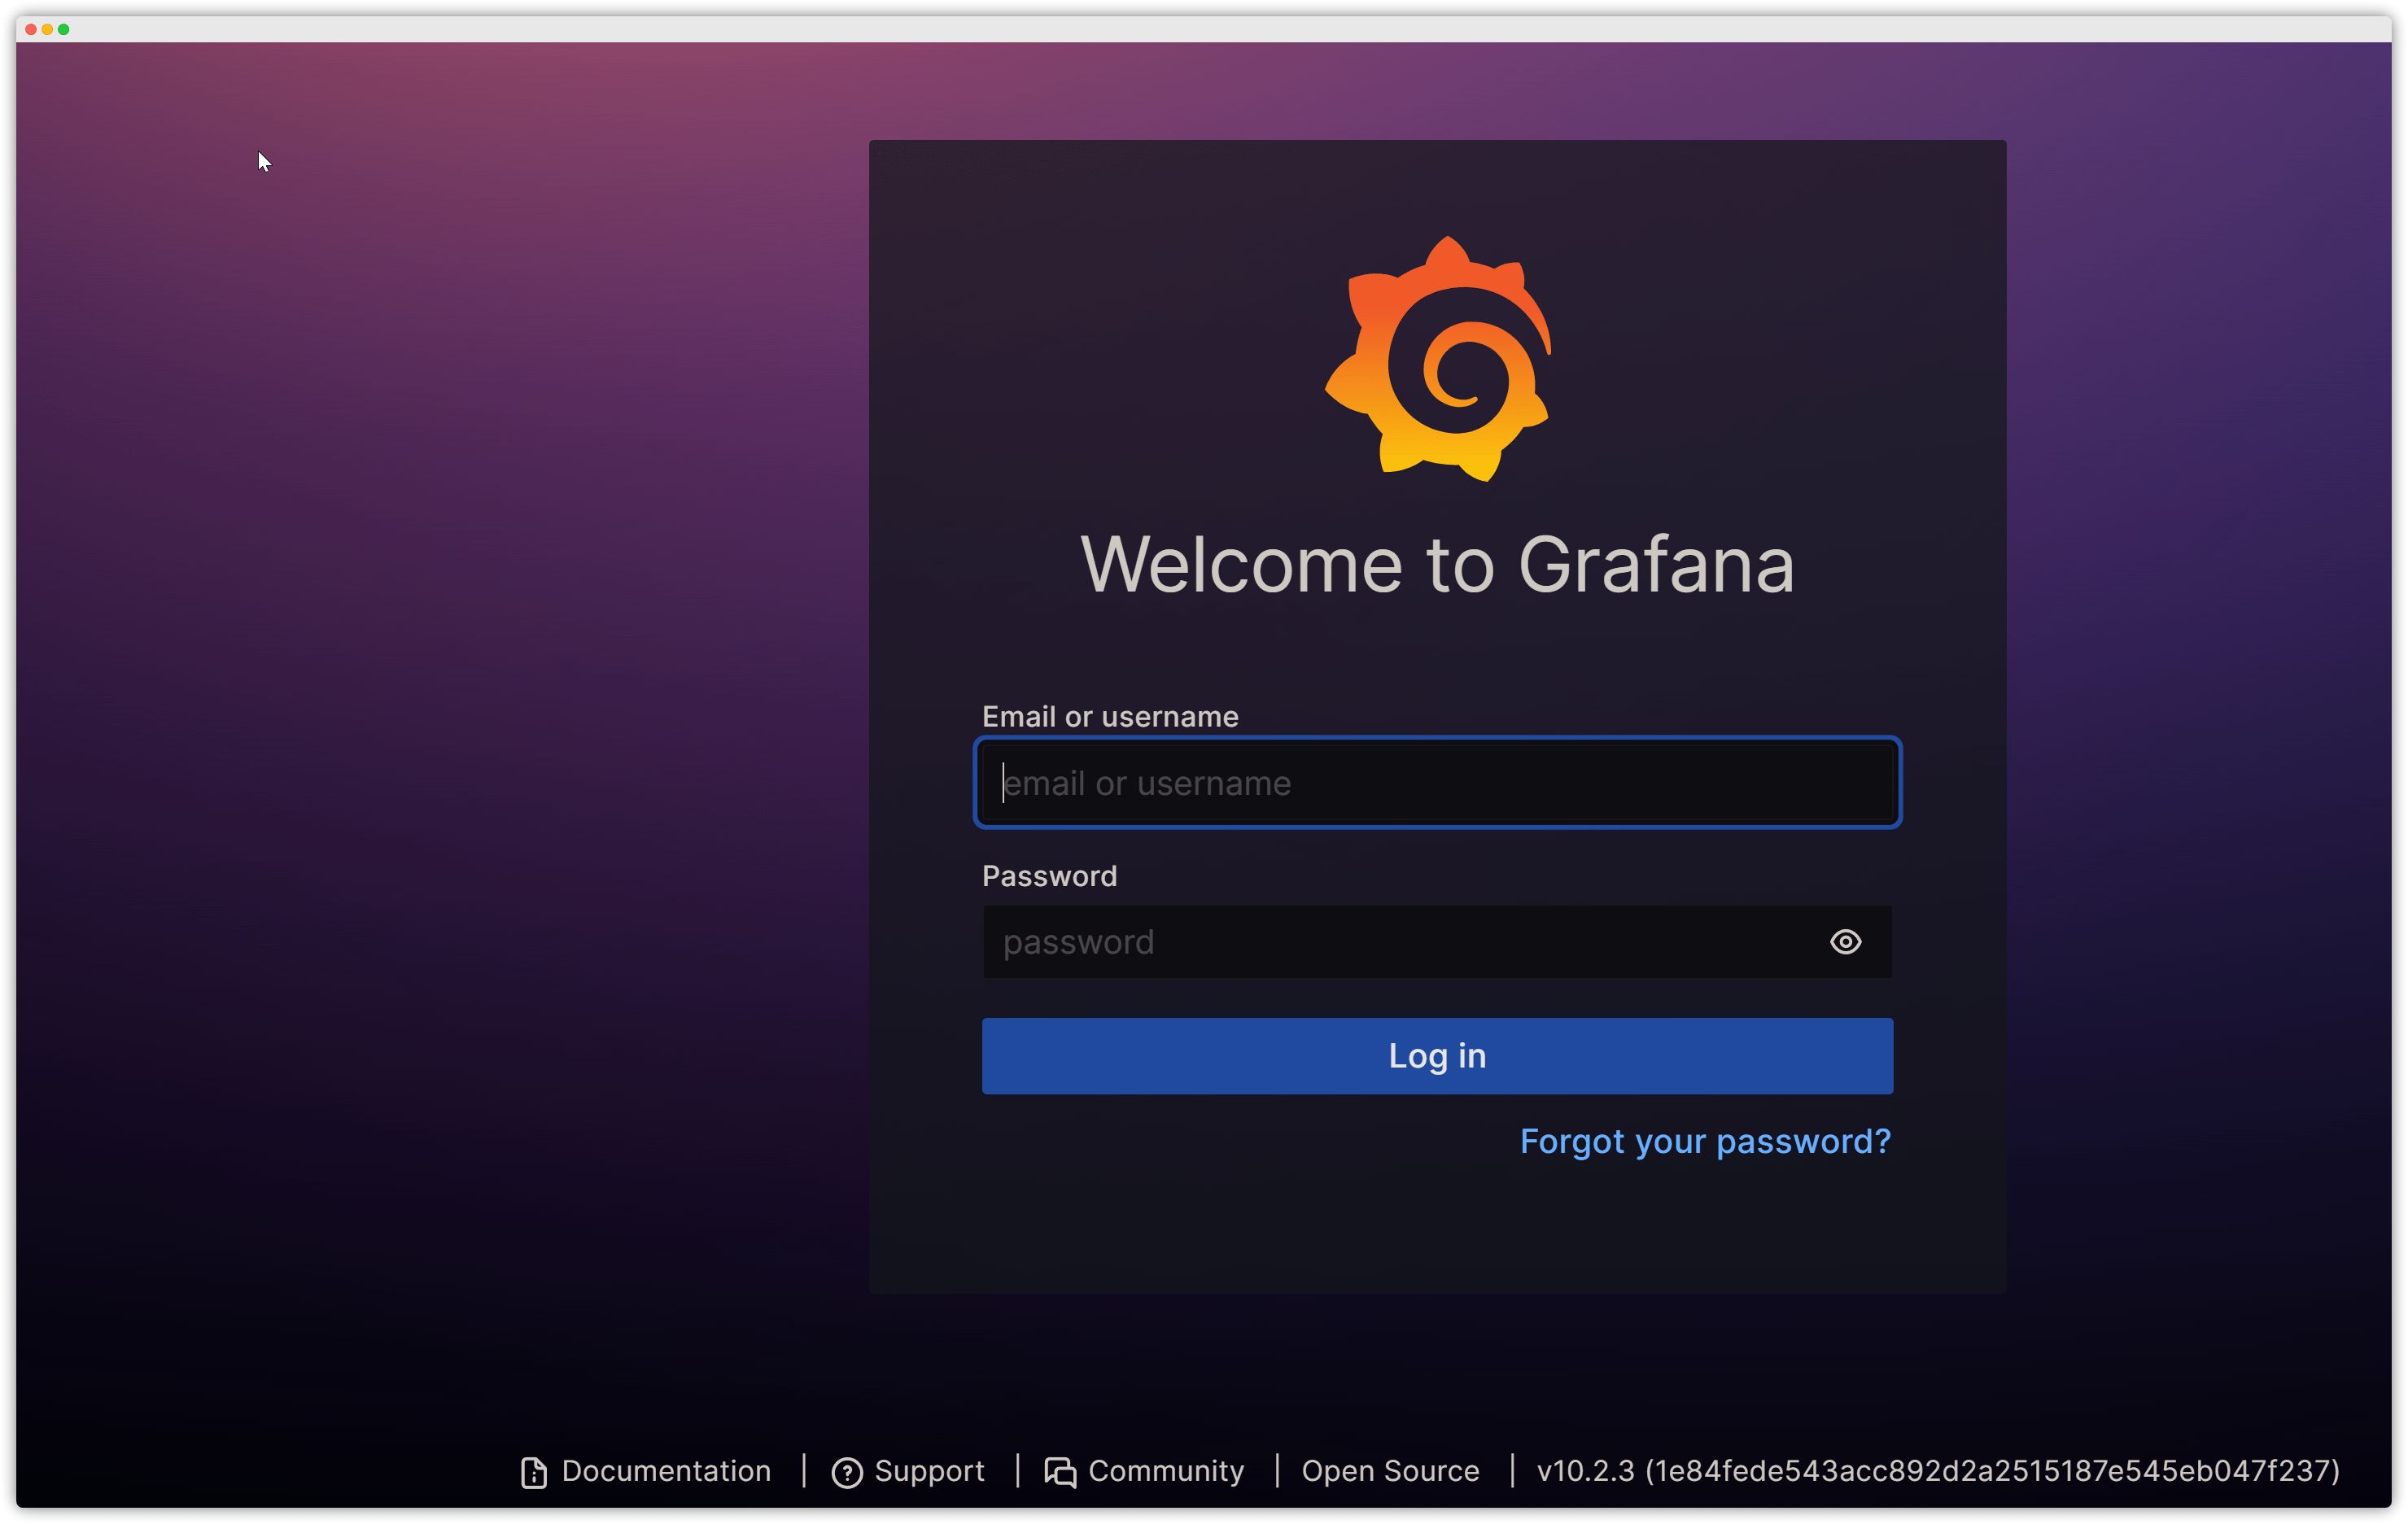
[root@VM-4-17-debian ~]# docker run -d -p 3000:3000 \--name grafana \-v /data/grafana-storage:/var/lib/grafana \-e "GF_SECURITY_ADMIN_PASSWORD=123456" \grafana/grafanaAccessing Grafana Web UI
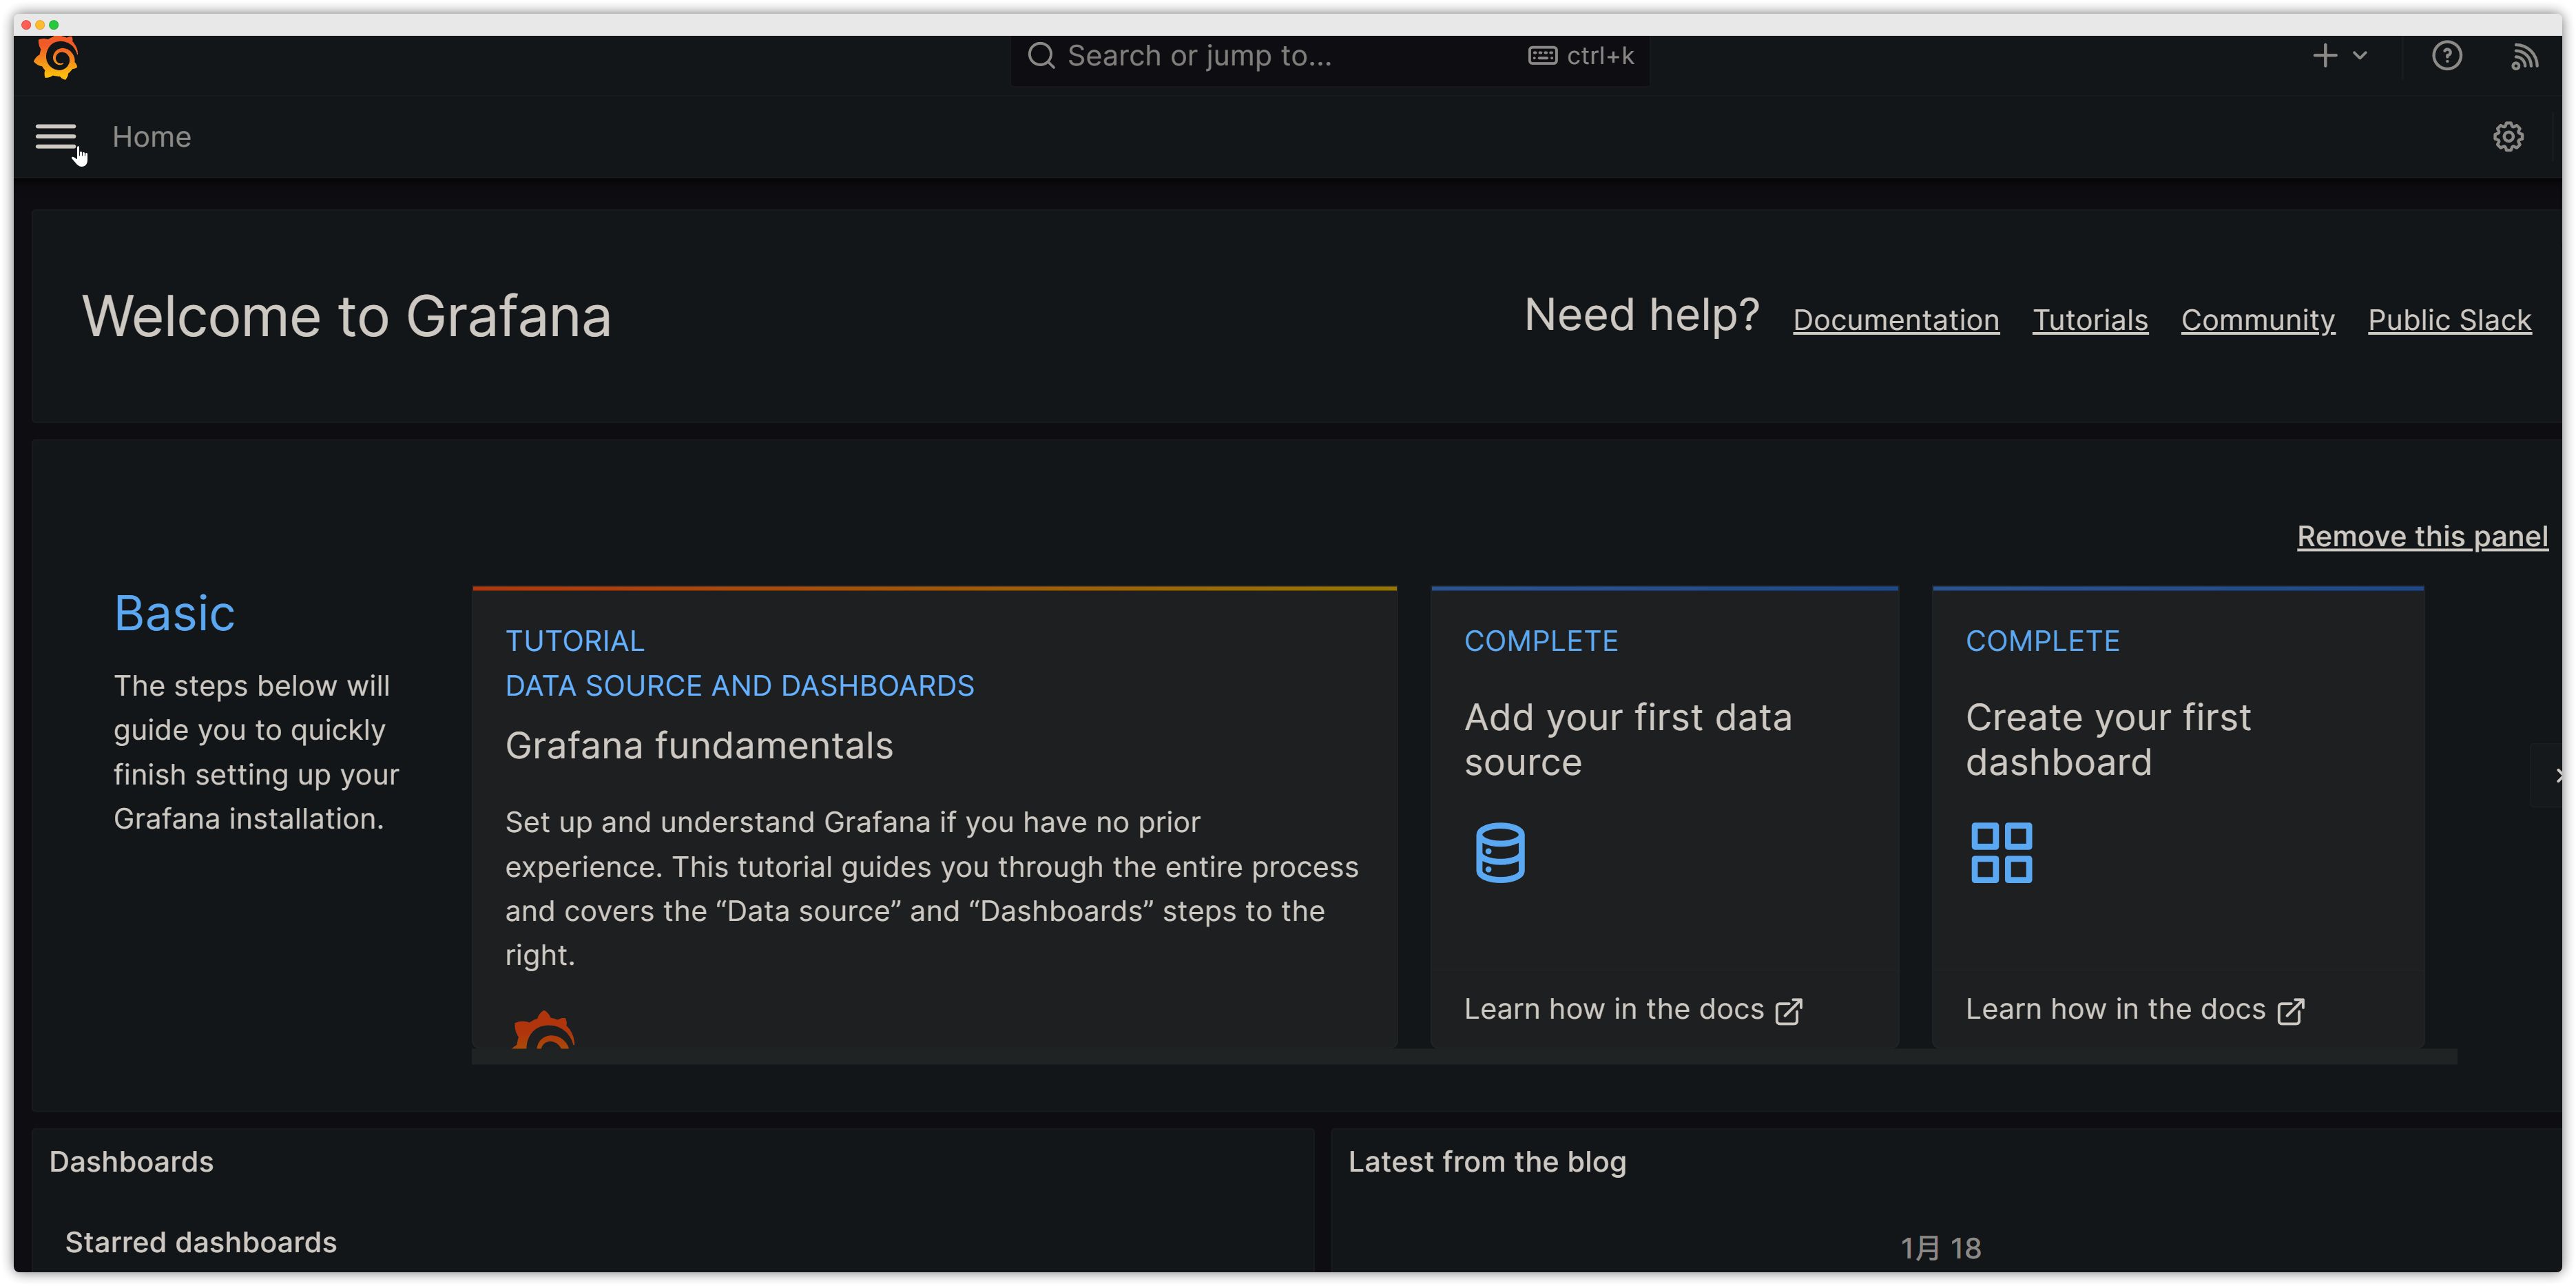
Open ip:3000 in your browser to verify. Username: admin, password: 123456.
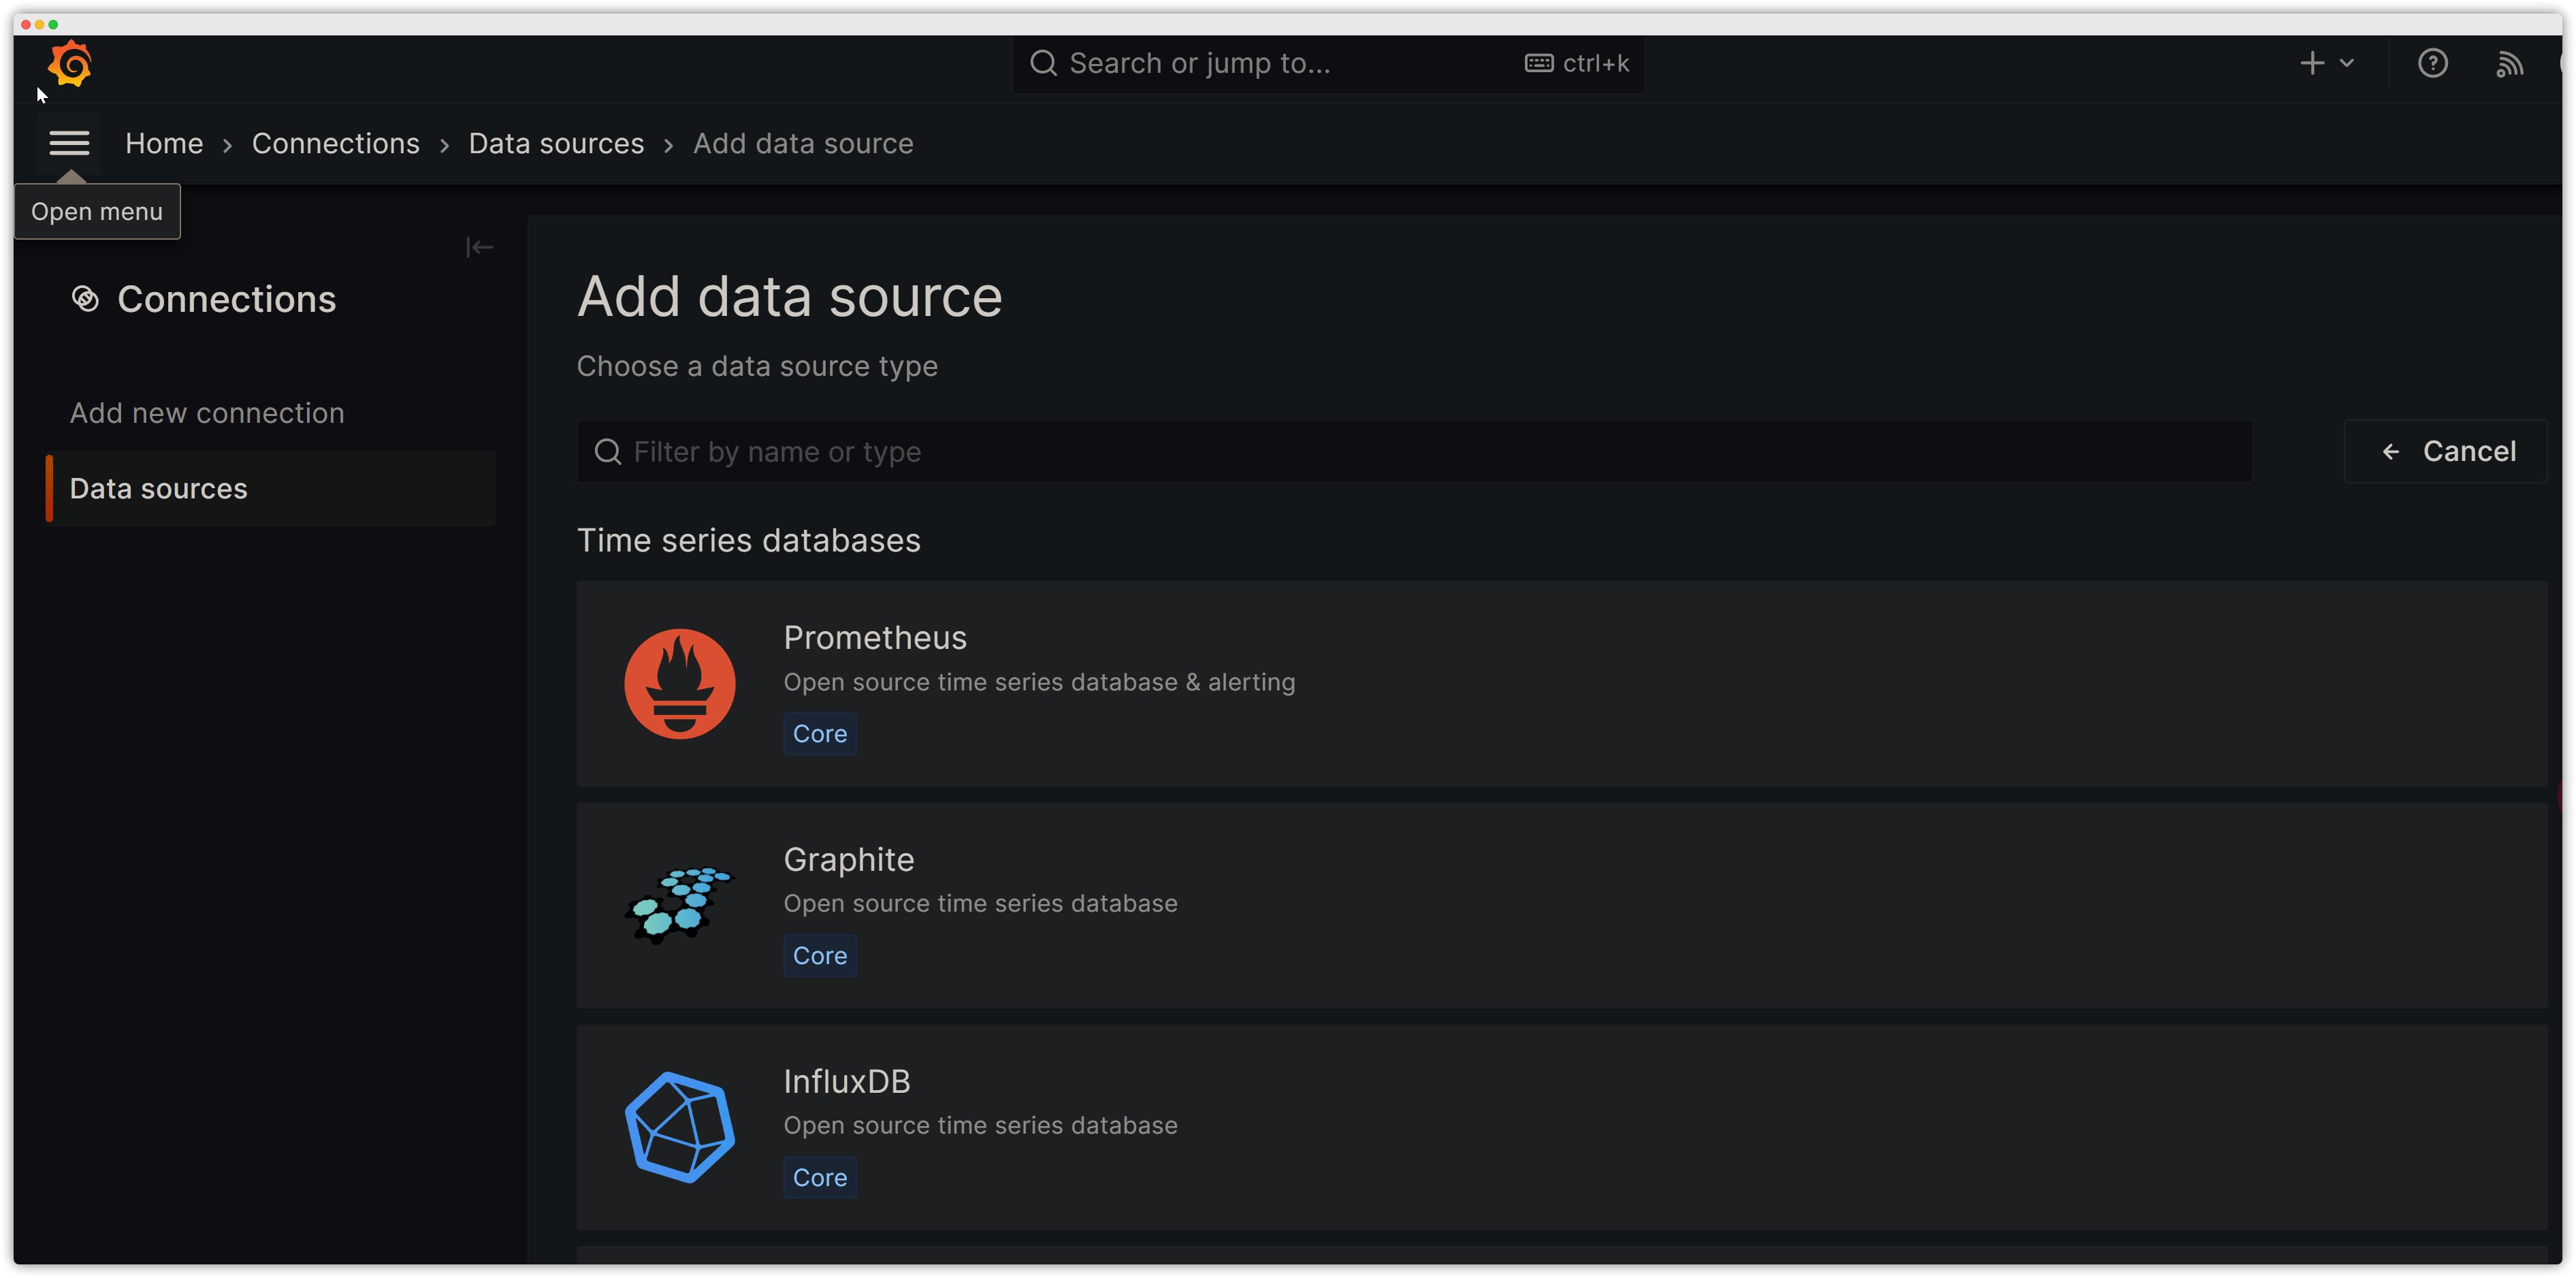
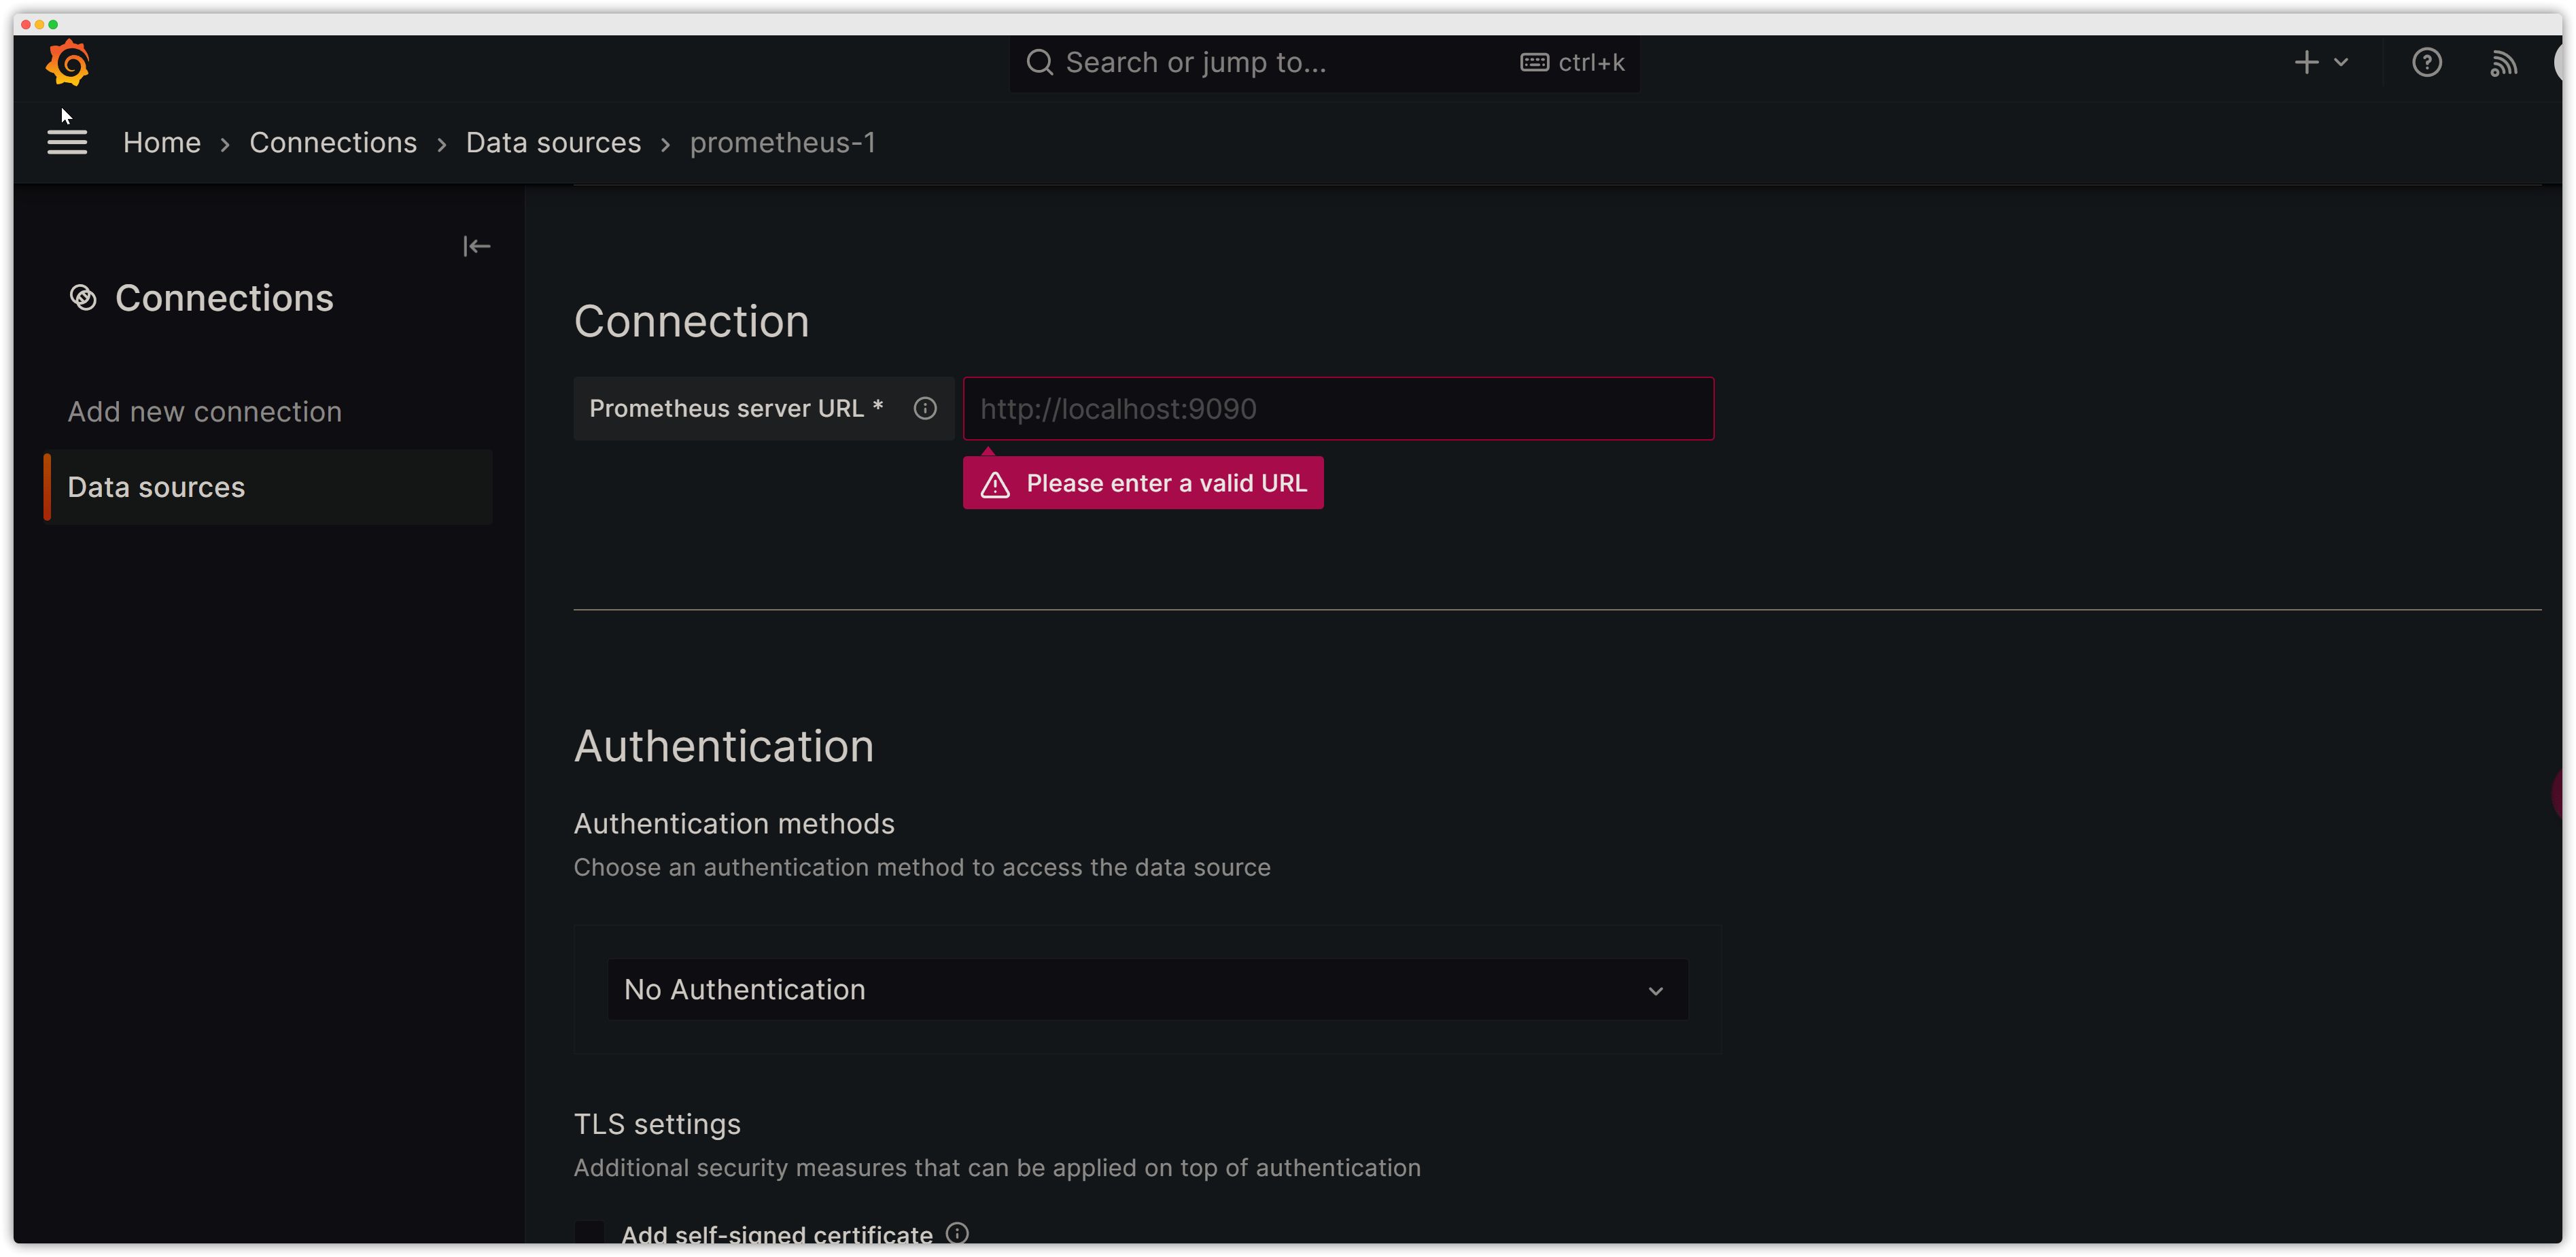
Add a Data Source
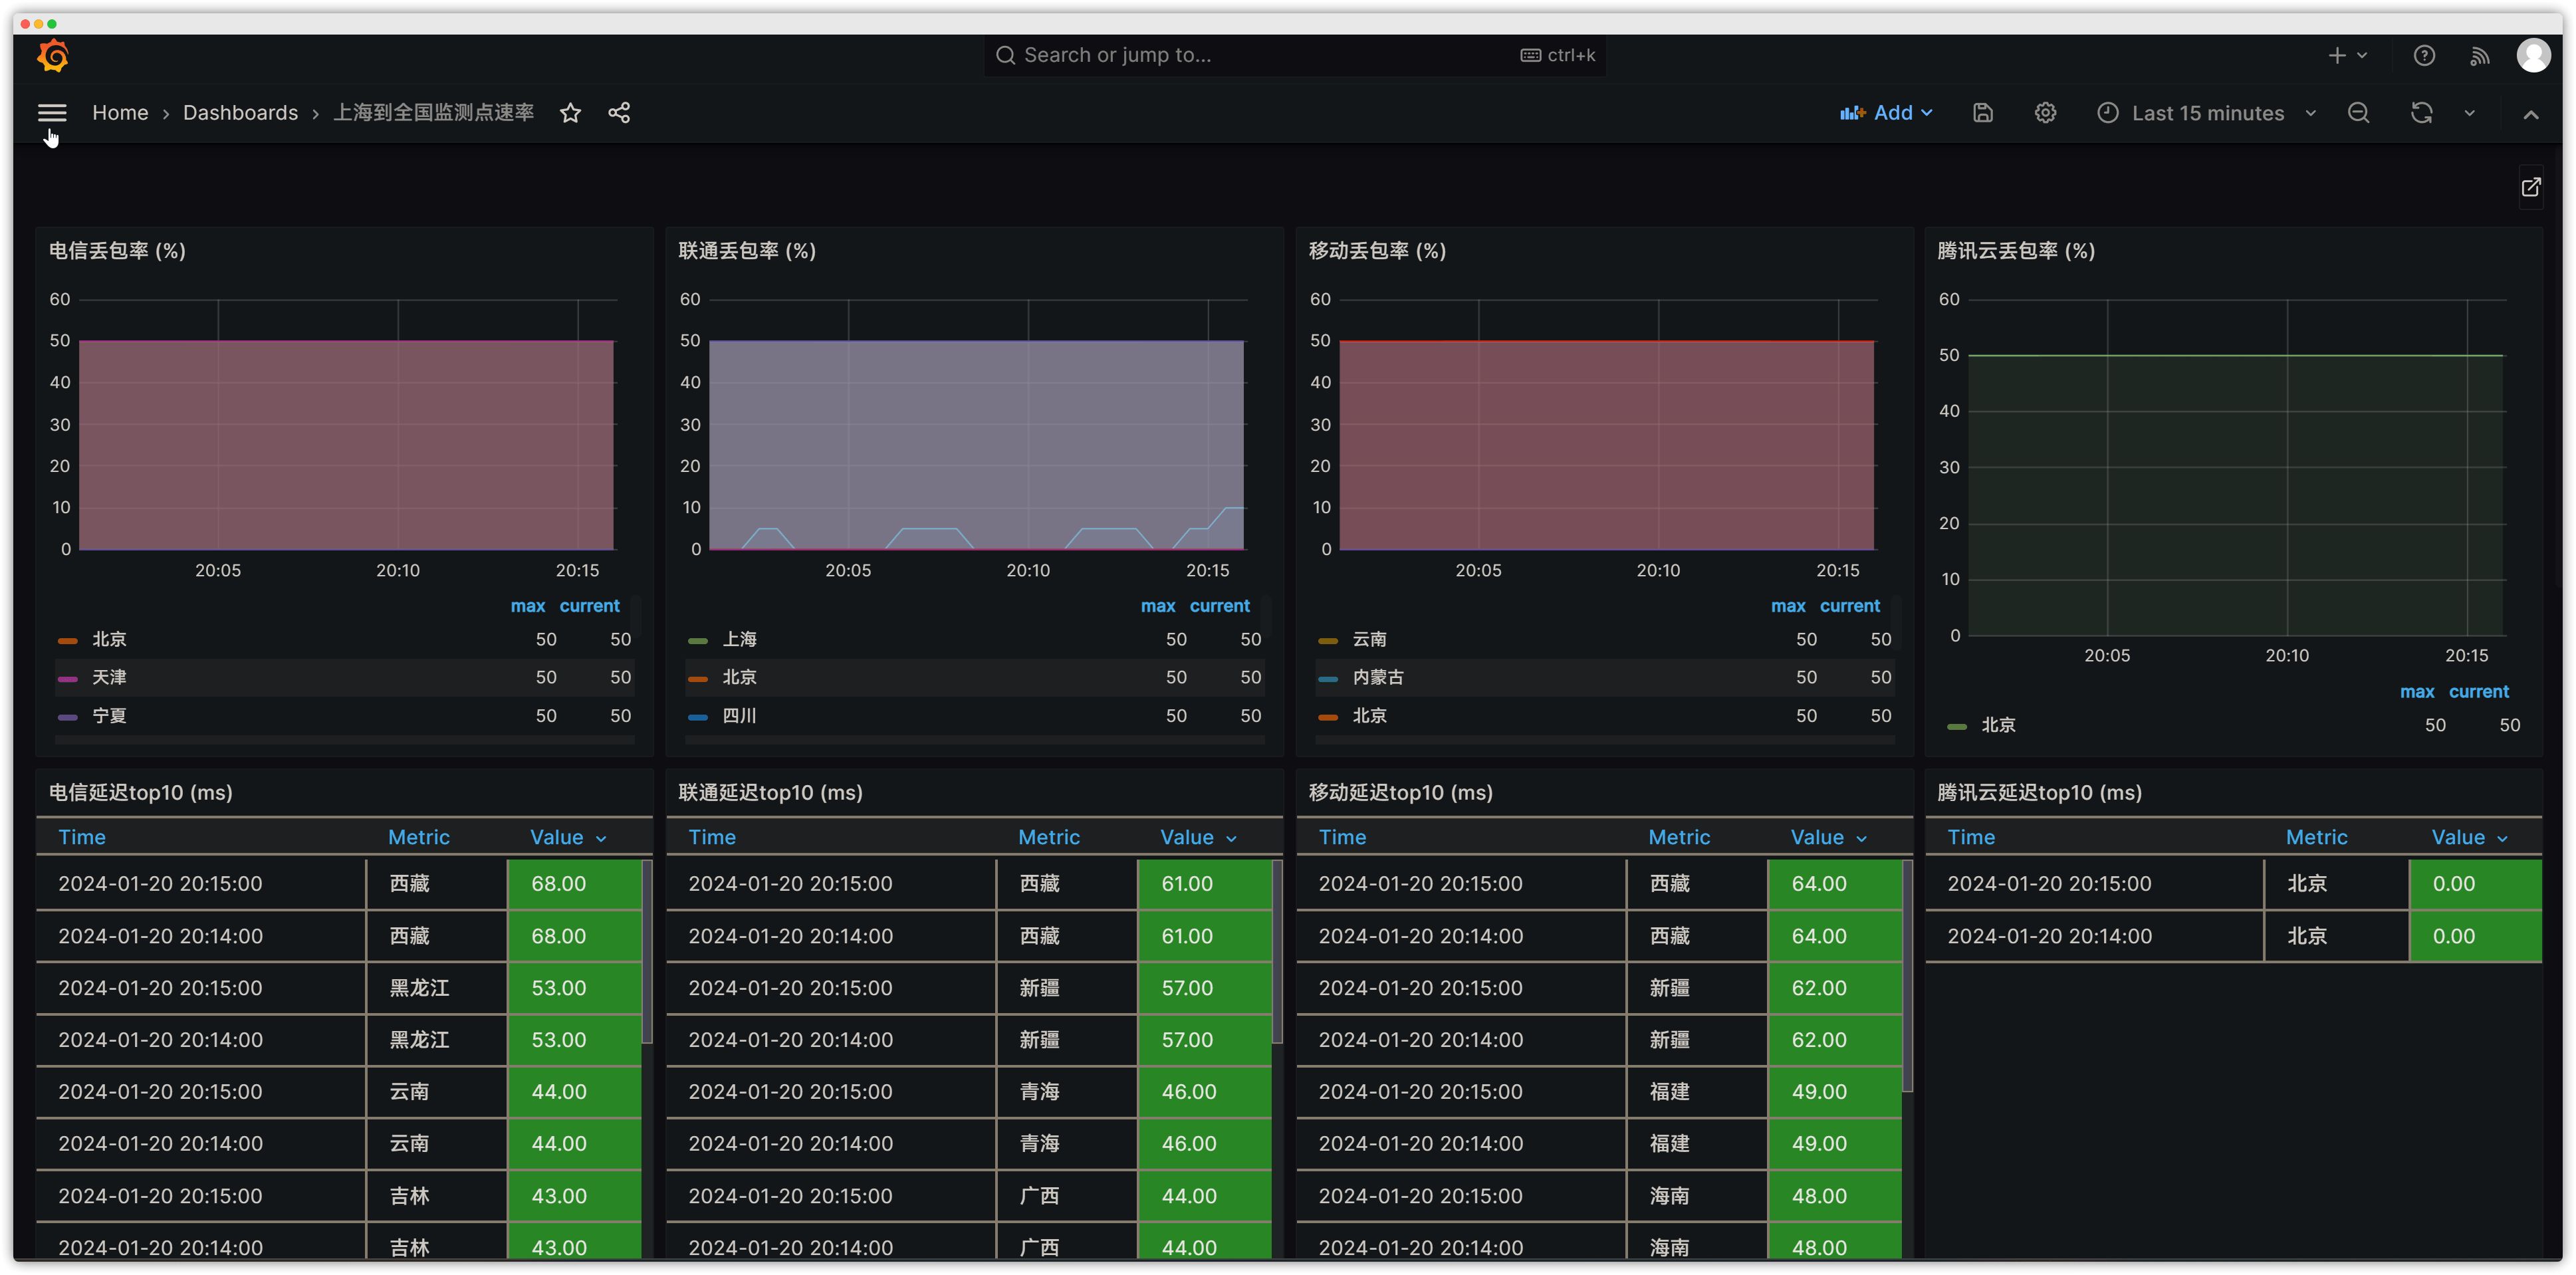
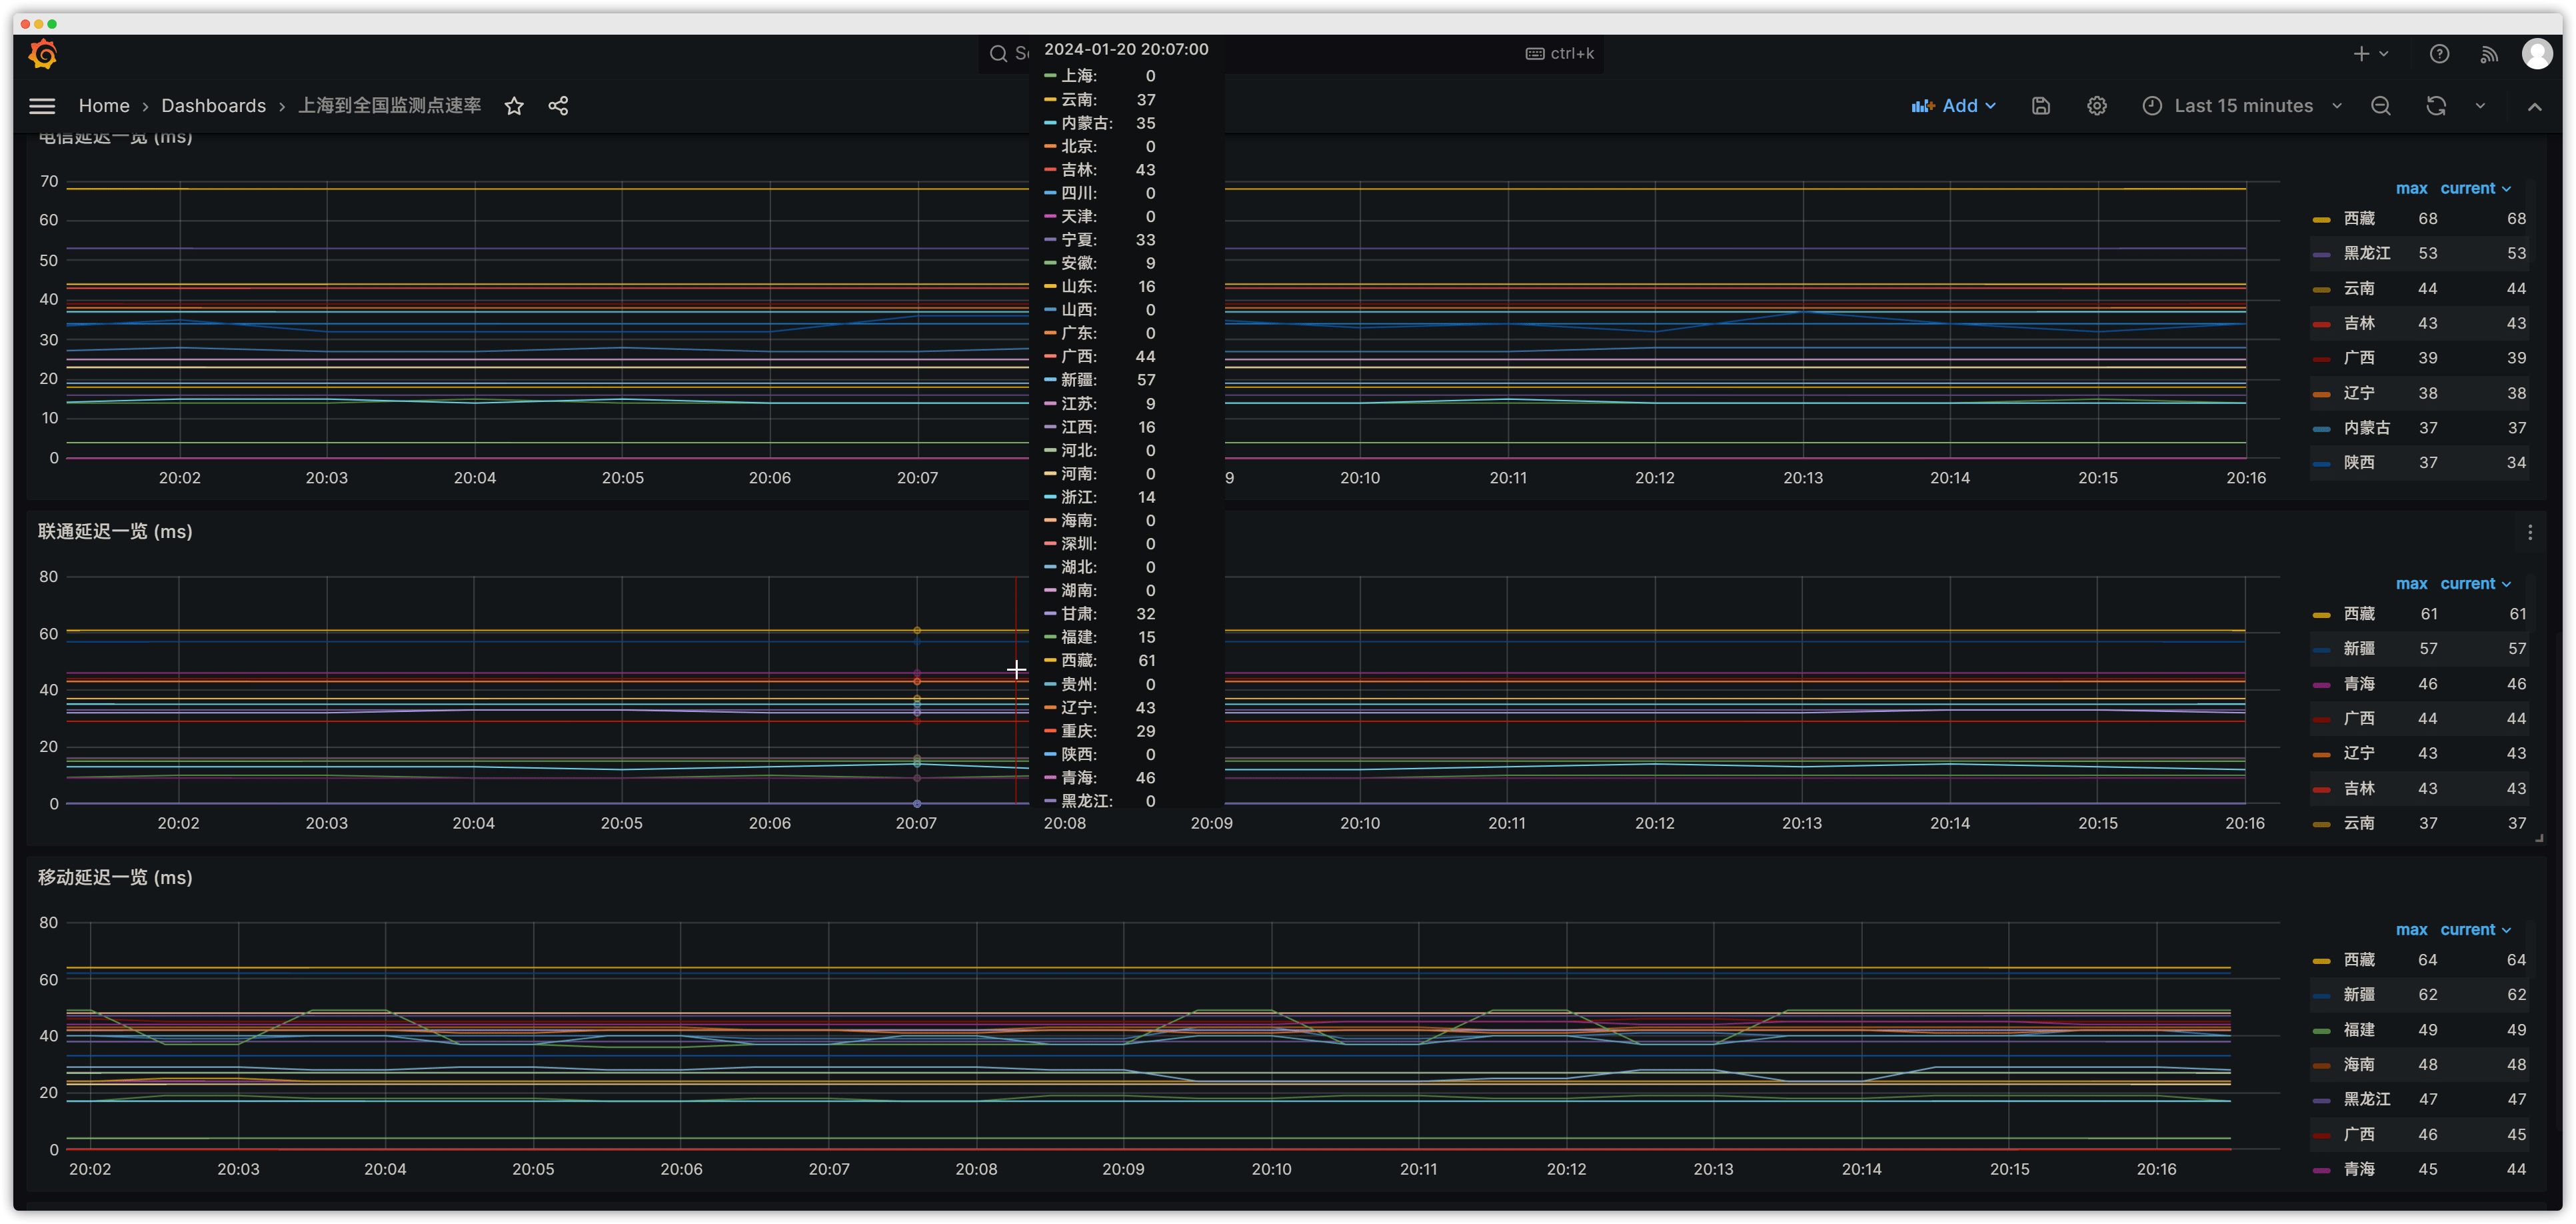
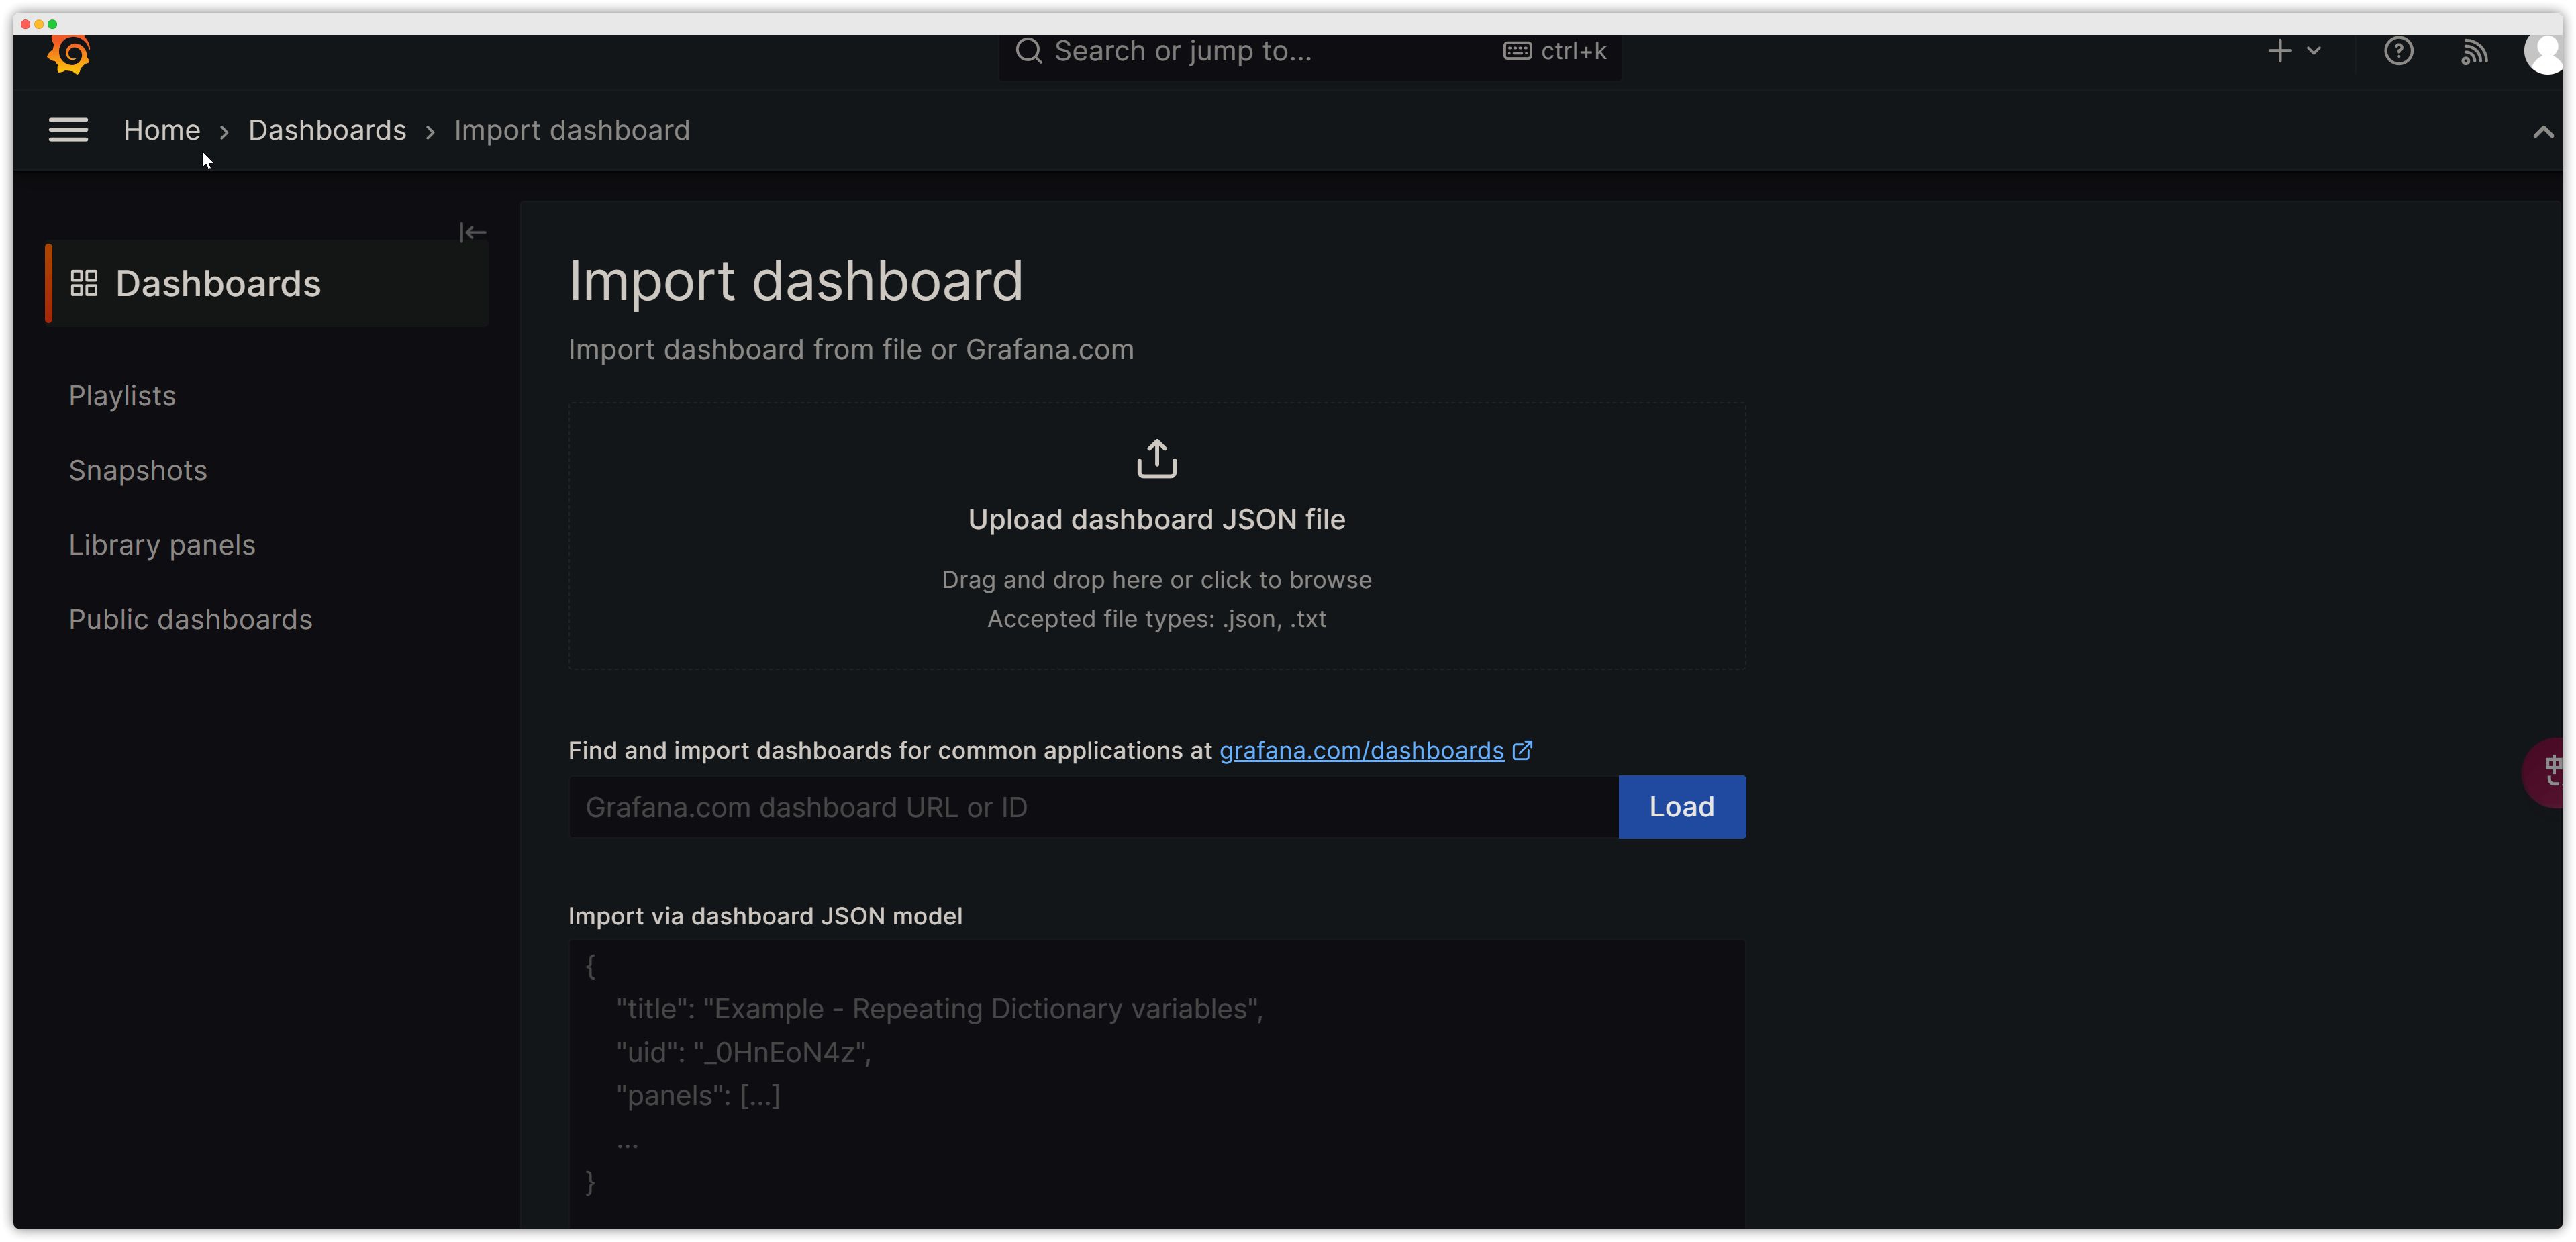
Add Monitoring Dashboards
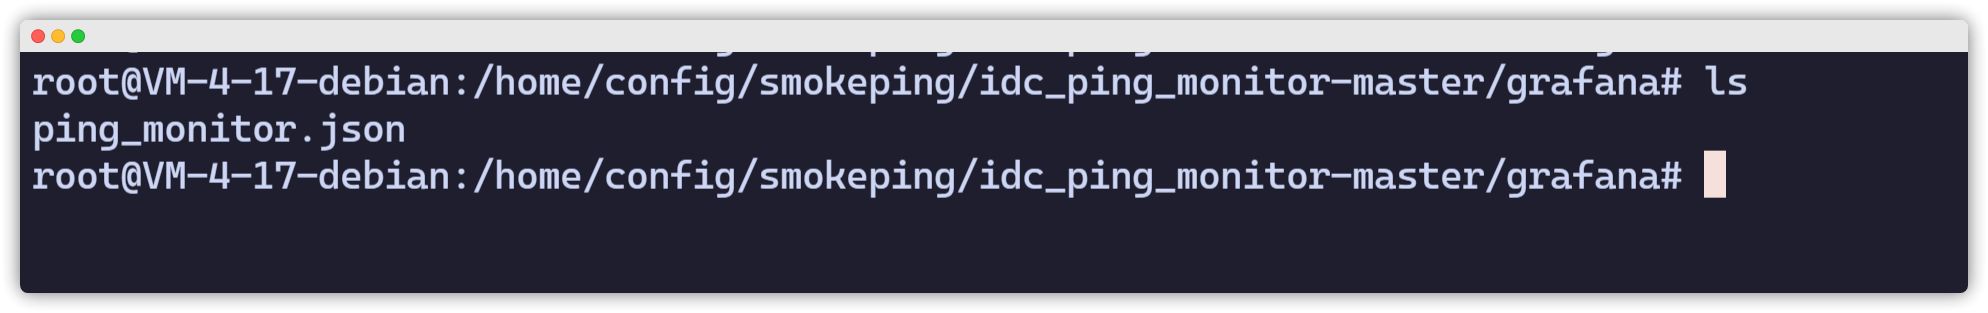
The JSON files are under the grafana folder.
Preview