
225 字
1 分钟
利用Grafana和Promethus在服务器上搭建BT下载器流量统计面板
2023-07-17
教程
Docker Grafana Prometheus
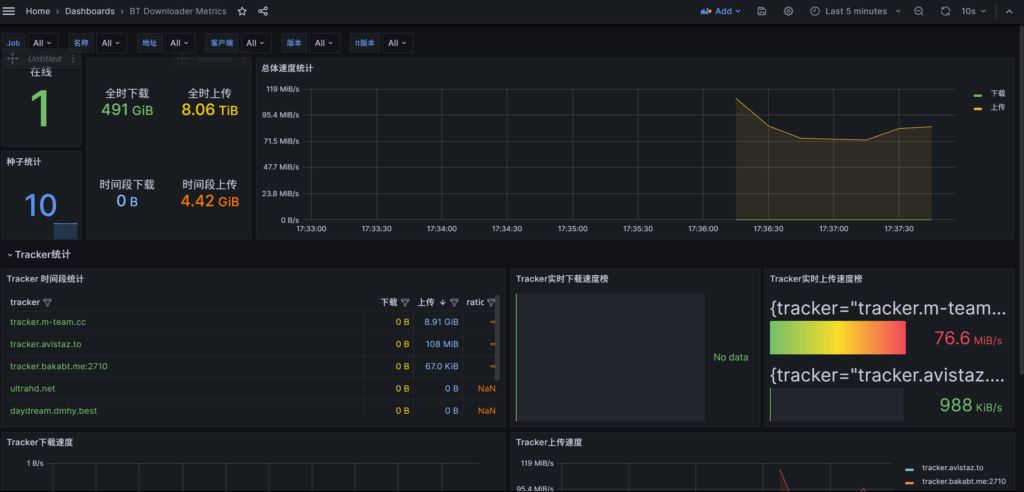
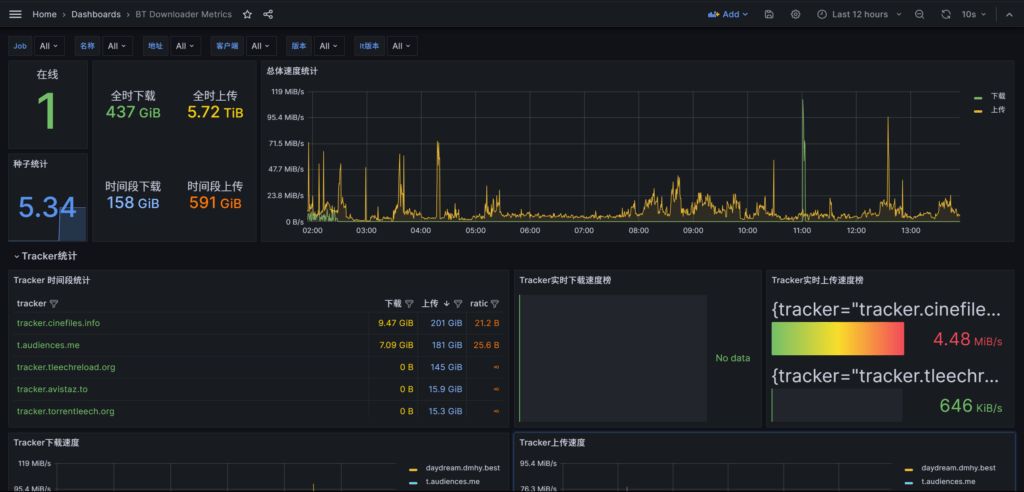
效果
准备工作
-
Grafana 和 Promethus部署成功
-
准备好你所有下载的用户名/密码并确保可联通
准备配置文件
vim config.yml
root@Sakura:~# cat config.ymlqb:
client: qbittorrent
host: http://ip:8080
username: your username
password: password
qb2:
client: qbittorrent
host: http://ip:8080
username: your username
password: password
de:
client: deluge
host: http://ip:prot
username: your username
password: password
tr:
client: Transmission
host: http://ip:prot
username: your username
password: password部署
docker run -d -p 9000:9000 -v /root/config.yml:/config/config.yml leishi1313/downloader-exporter其中/root/config.yml是你上面文件的位置,可以使用pwd命令查看

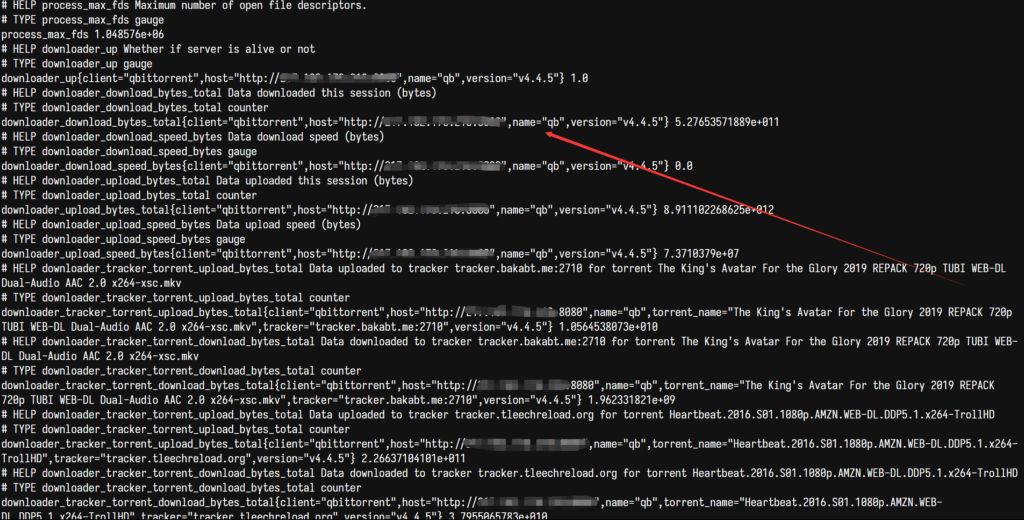
检查是否成功连接
IP:9000确认下是否有如下页面,有类似输出代表downloader-exporter成功部署
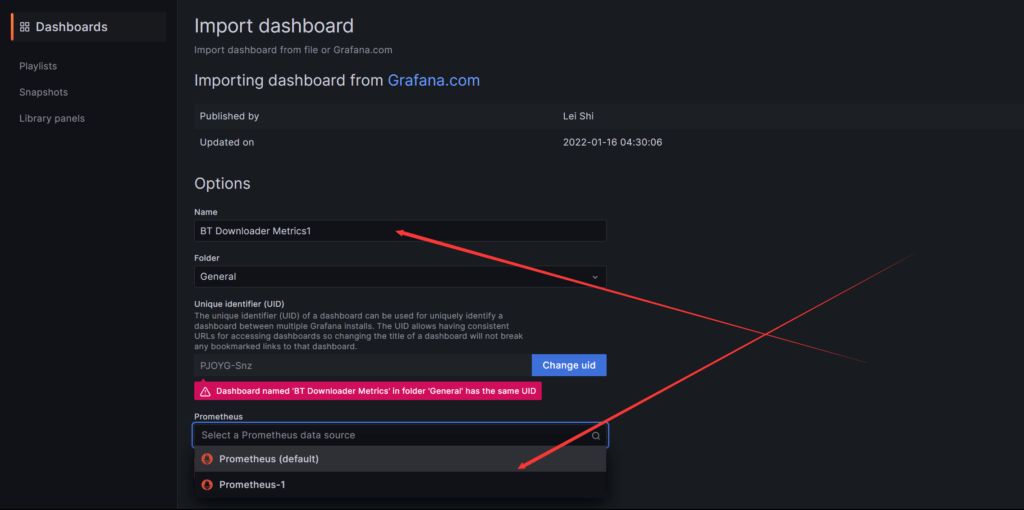
Grafana新建面板
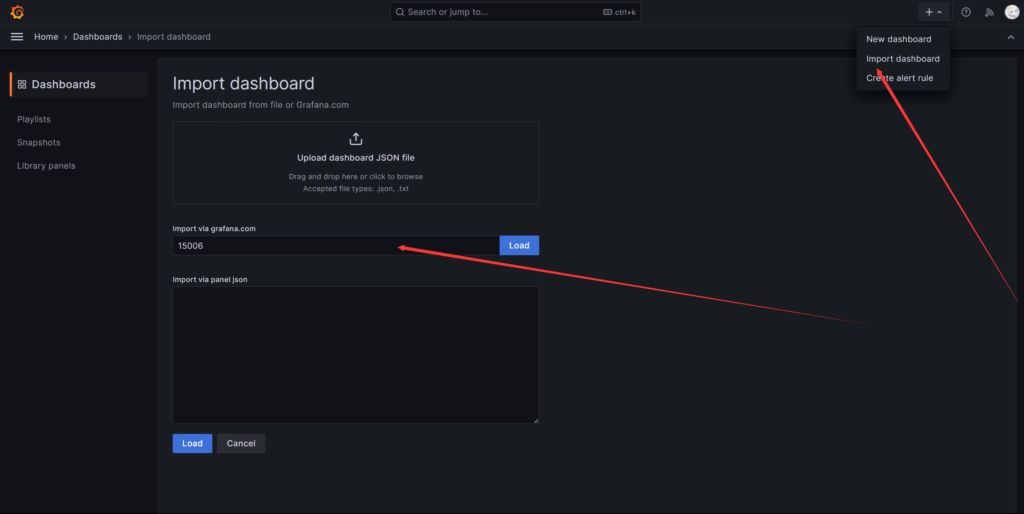
选择数据源
利用Grafana和Promethus在服务器上搭建BT下载器流量统计面板
https://catcat.blog/grafana-promethus-bt-dashboard.html