One-Command Docker Deployment for GPU Monitoring Dashboard GPU Hot
A clean, beautiful, and lightweight real-time GPU monitoring solution that you can deploy with just a single command.
Preface
When using a machine day to day, GPU usage is often the metric we care about most. I used to rely on Grafana + Prometheus + Nvitop for GPU monitoring. That stack is undeniably powerful, but its downsides are obvious: complicated configuration, relatively heavy resource usage, slow startup, and when you only want to quickly check temperatures and VRAM usage on a few cards, it hardly feels worth spinning up a full monitoring system.
Until I randomly came across this project on GitHub —
Deployment is extremely simple, the UI is clean and modern, and the feature set hits a very practical sweet spot. You can even think of it as a “GPU version of Glances” or a “lightweight GPU dashboard”.
Preview UI
Below are screenshots from an actual deployment. You can see that each GPU has its own dynamic charts, covering not just temperature, power, and utilization, but also fan speed and VRAM usage trends.
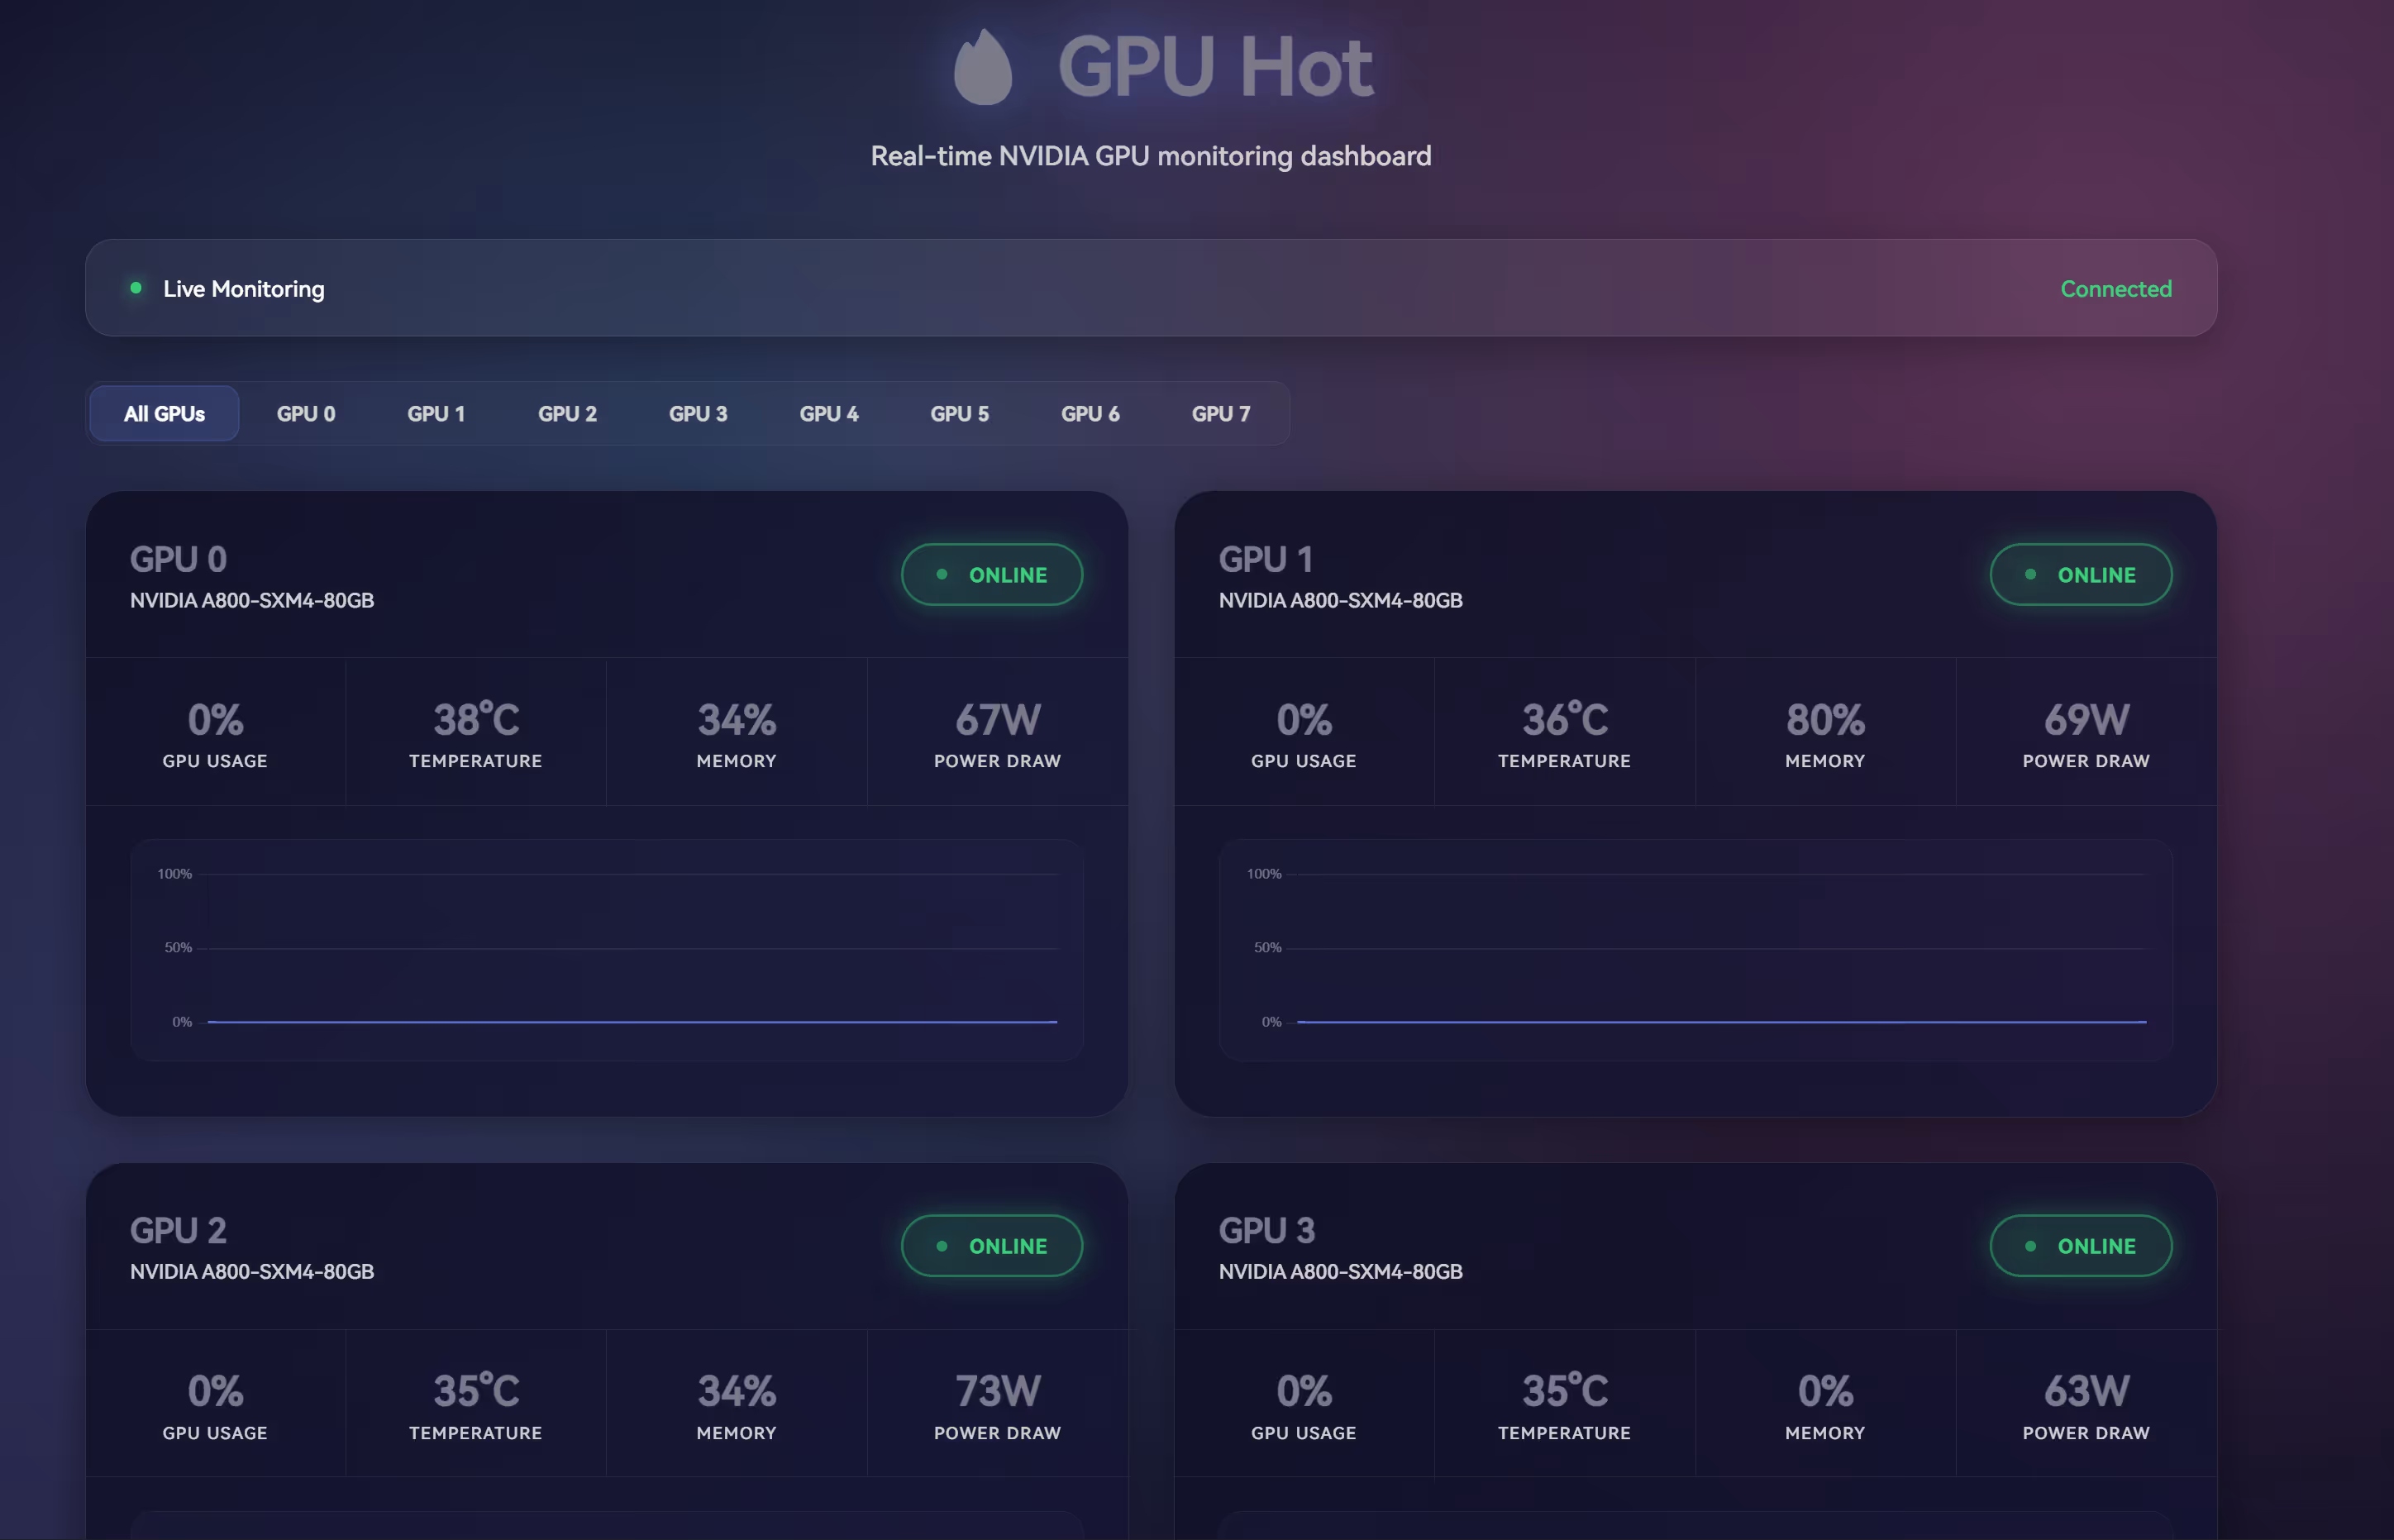
The overall style has a strong “Grafana vibe”, but is far more lightweight, and the data refresh is very smooth.
Features
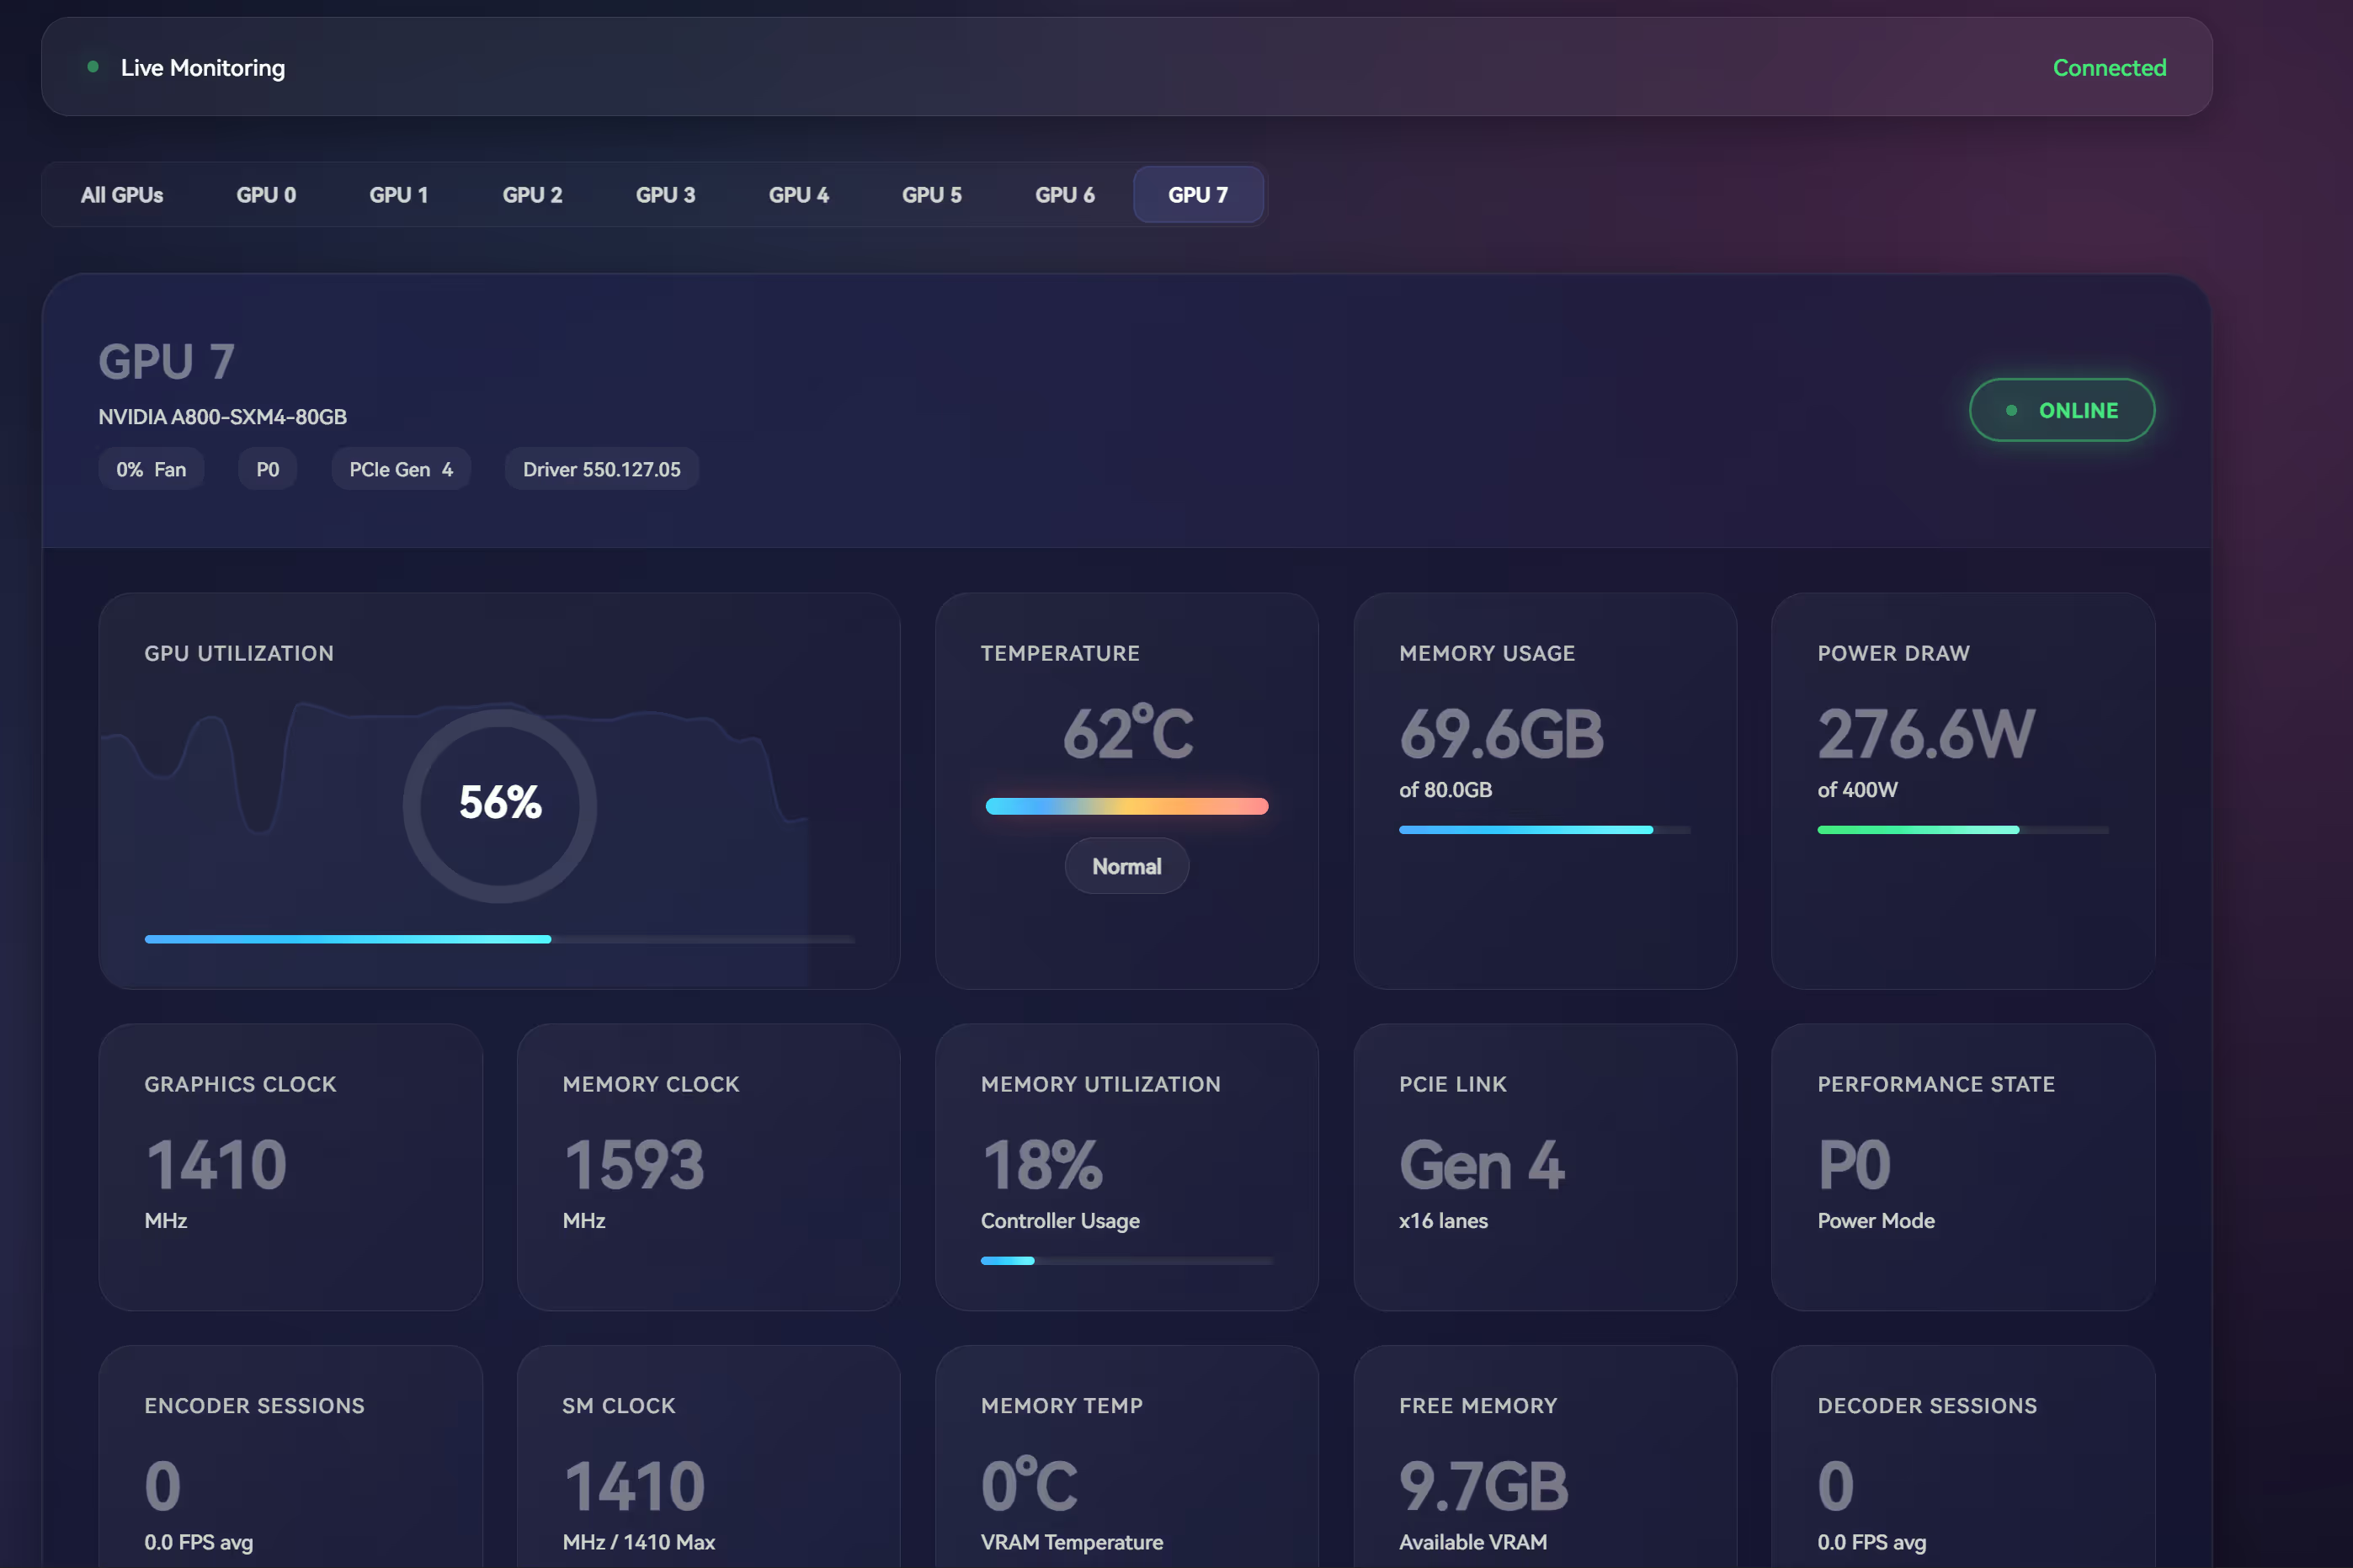
Seven charts per GPU:
- GPU utilization
- Temperature (core / memory)
- VRAM usage
- Power draw
- Fan speed
- Clock frequency (graphics core / SM / memory)
- Power efficiency
Monitoring capabilities:
-
✅ Automatic multi-GPU detection
-
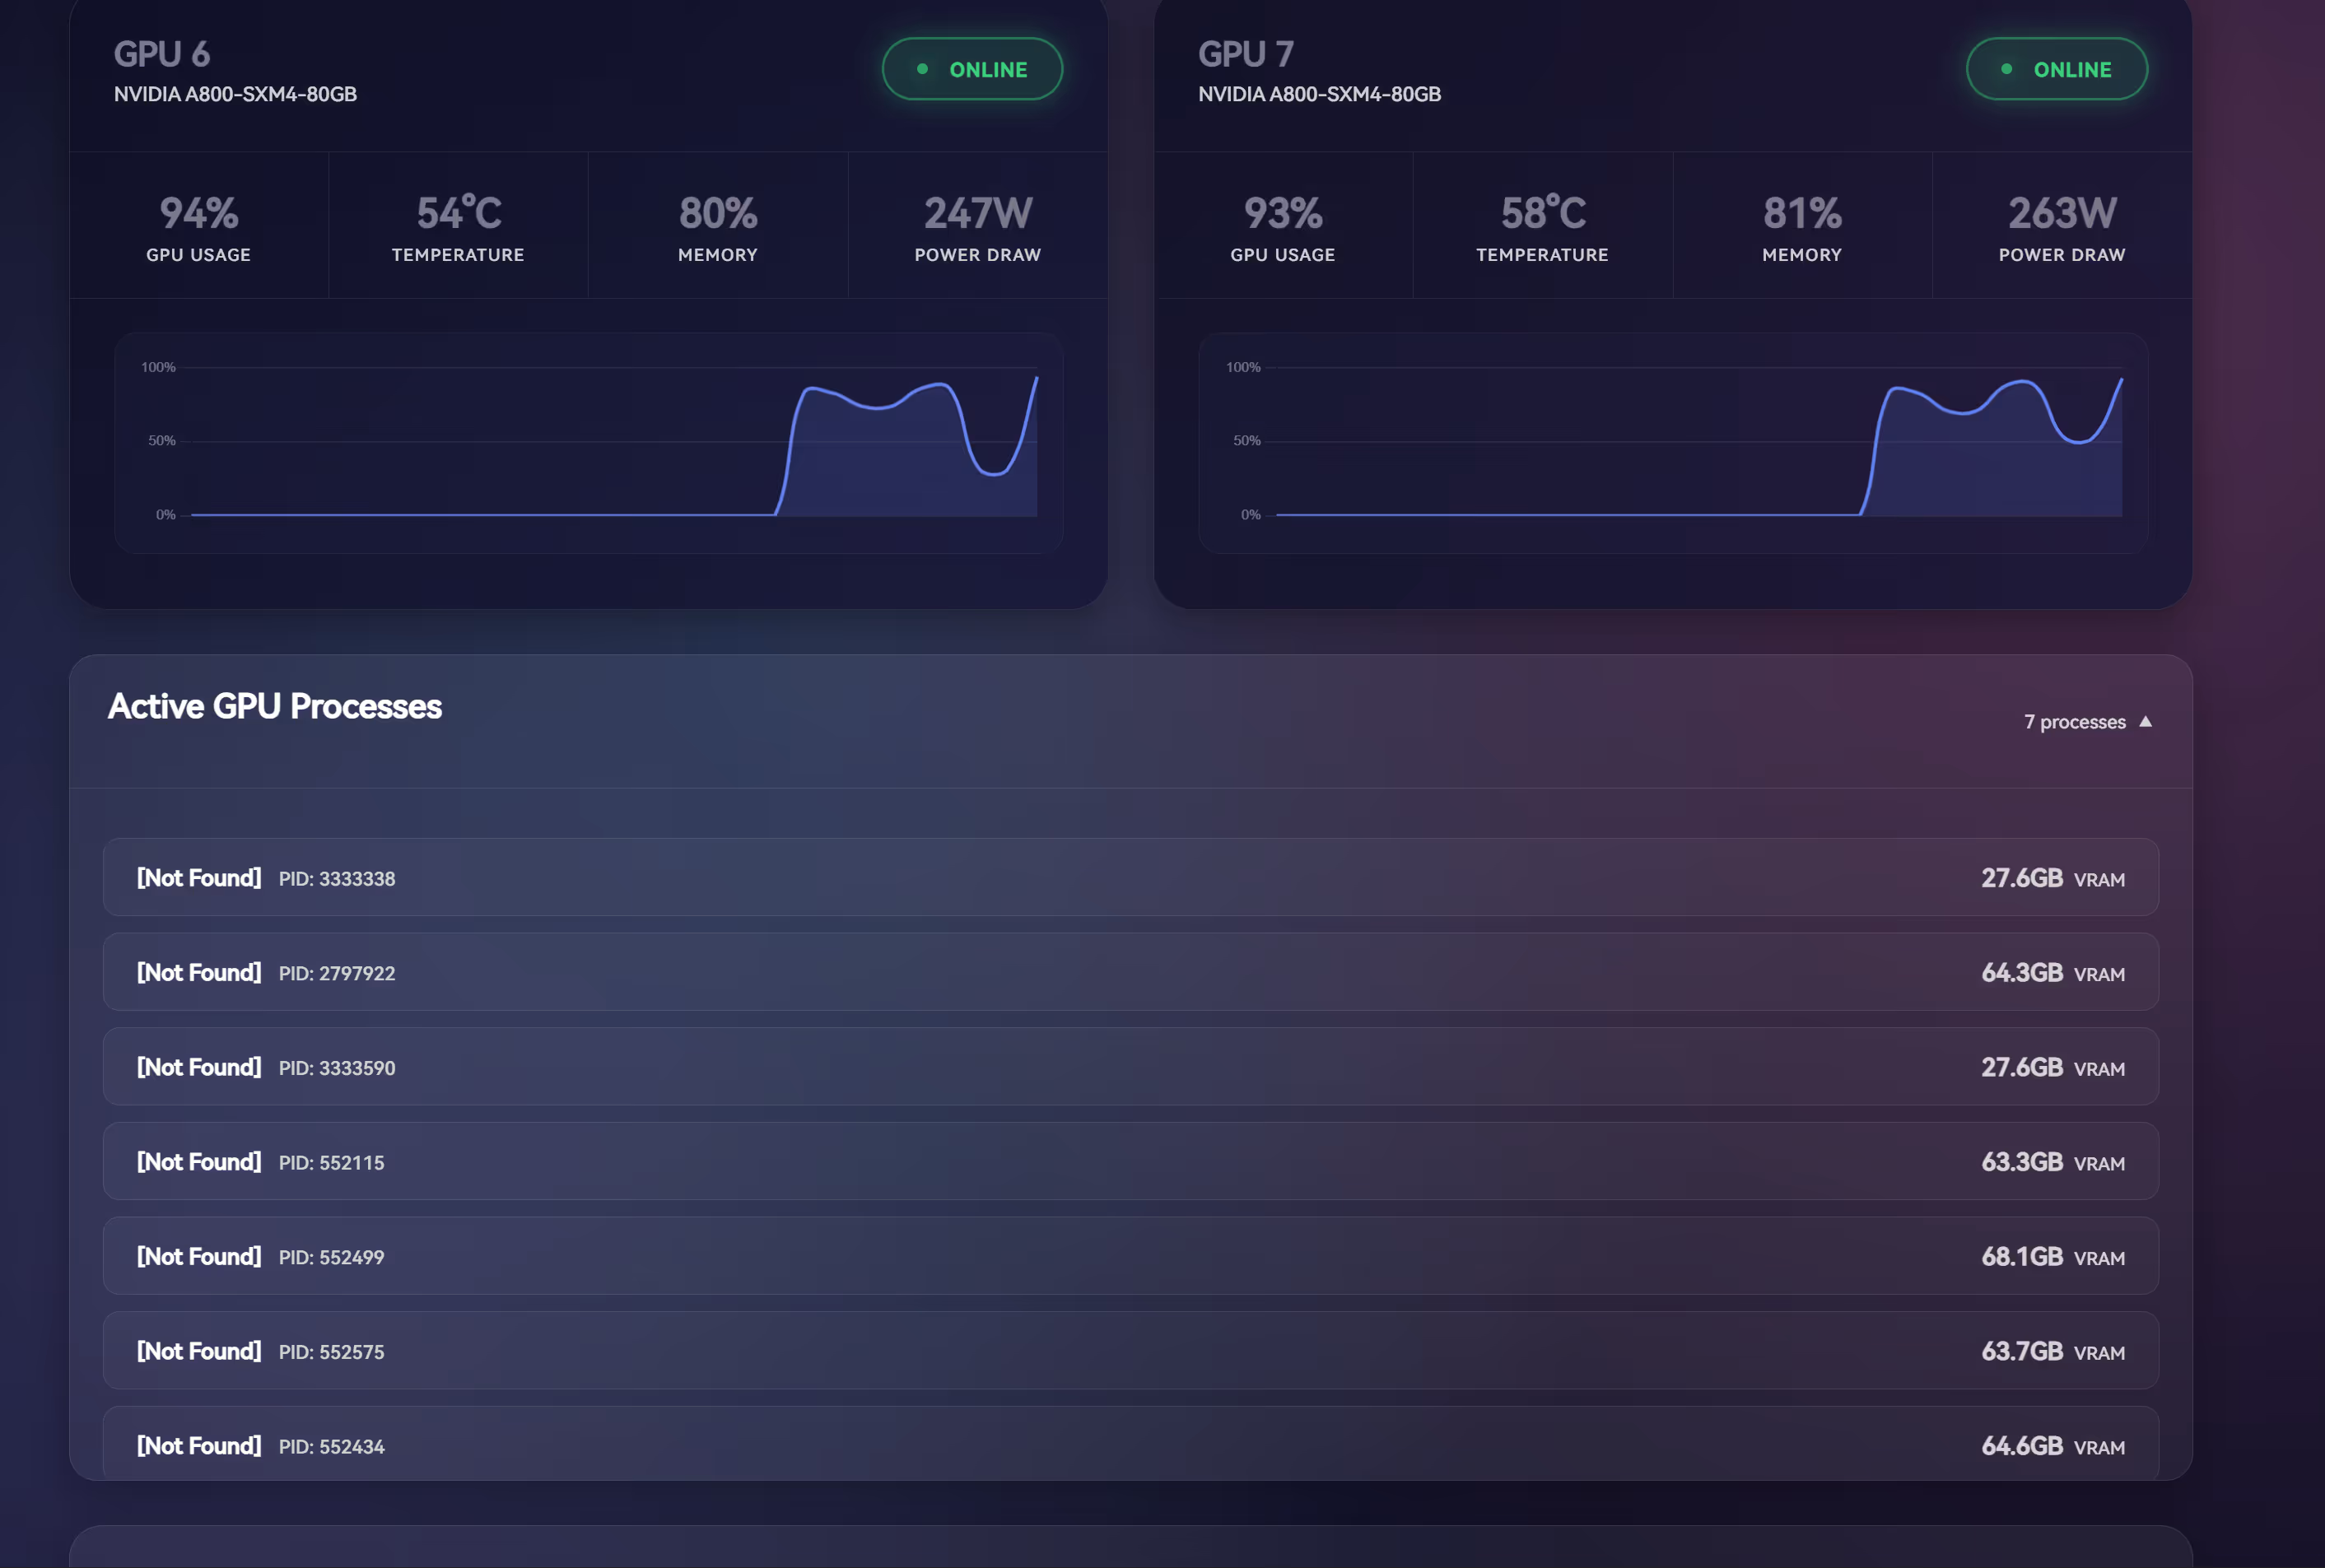
✅ GPU process tracking (PID, VRAM usage)
-
✅ System CPU / memory (RAM) usage
-
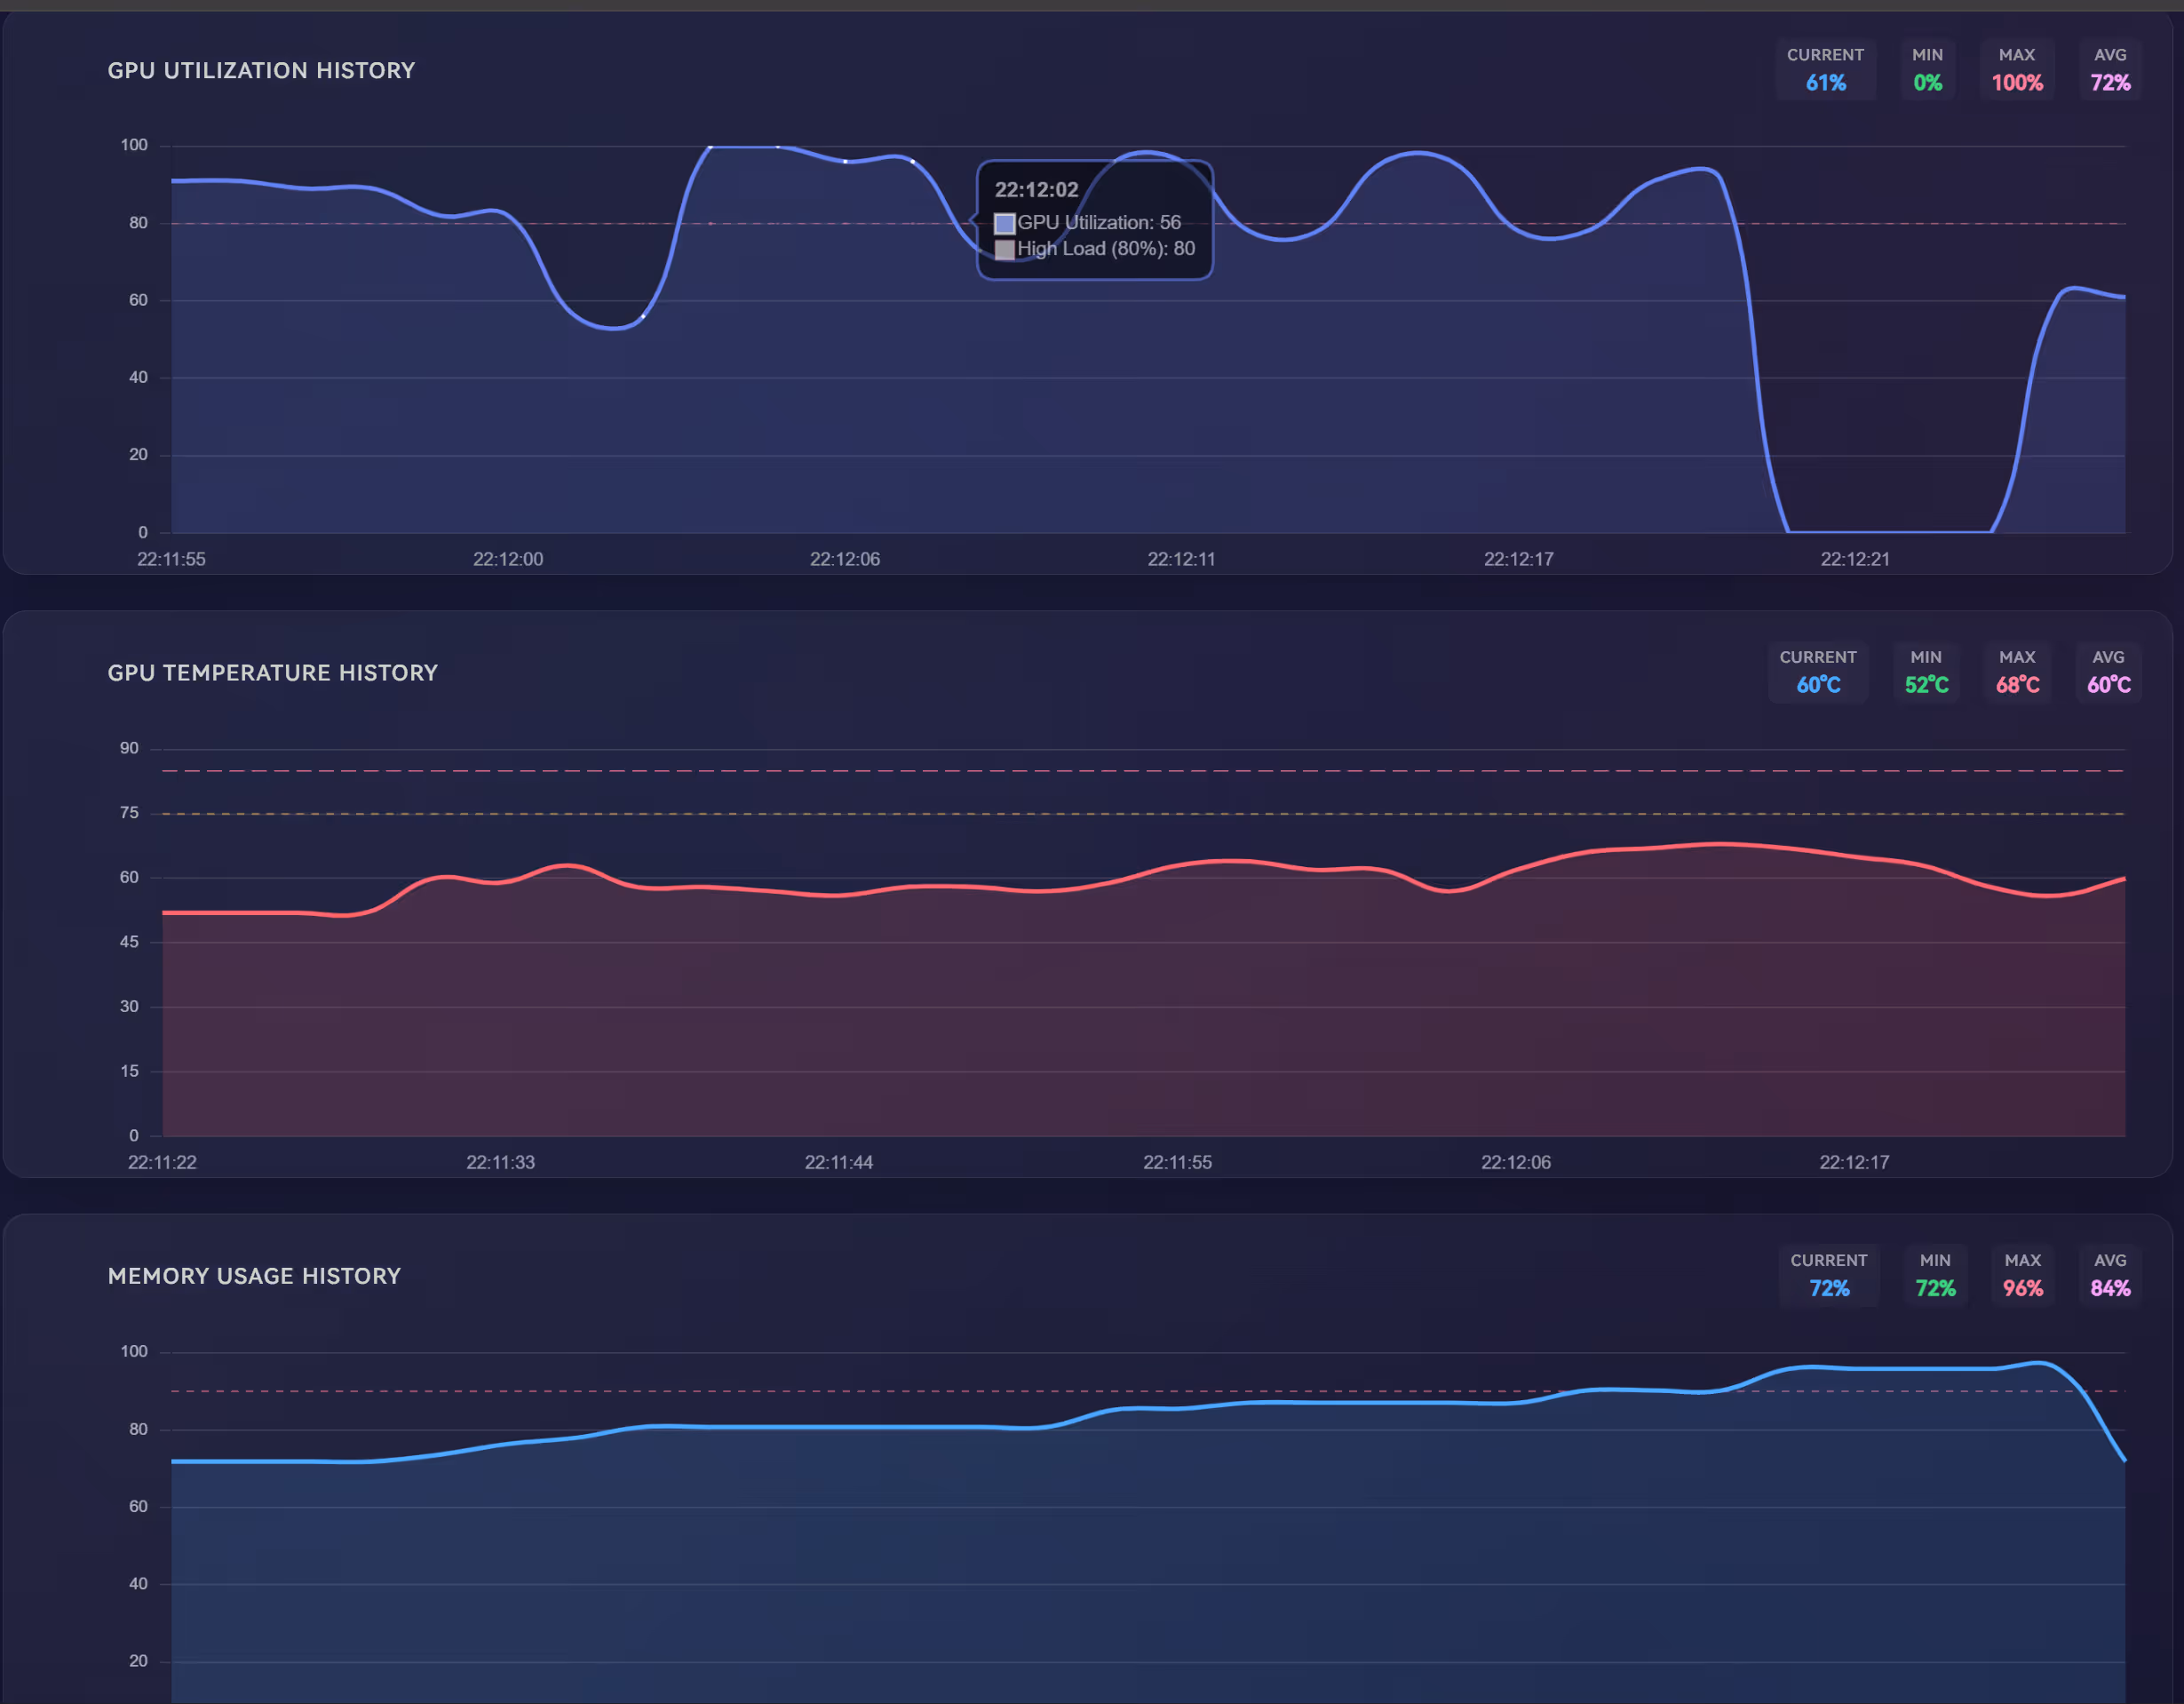
✅ Threshold markers:
- Temperature: 75°C / 85°C
- Utilization: 80%
- VRAM usage: 90%
Collected metrics
Core Metrics:
- GPU and VRAM utilization (%)
- GPU core / memory temperature (°C)
- VRAM usage (used / free / total, MB)
- Power: current draw and limit (W)
- Fan speed (%)
- Clock frequencies: graphics core / SM / memory / video decode (MHz)
Advanced Metrics:
- PCIe generation and lane width (current / maximum)
- Performance state (P-State)
- Compute mode
- Encode / decode sessions and statistics
- Driver and VBIOS versions
- Throttle status
Deployment (One-Command Docker Startup)
Requirements
- ✅ Docker
- ✅ NVIDIA Container Toolkit
👉 Official installation guide
Run command
You only need a single line:
docker run -d --name gpu-hot --gpus all -p 1312:1312 ghcr.io/psalias2006/gpu-hot:latestThen open your browser and visit:
You’ll be greeted with a beautiful GPU monitoring dashboard. No extra configuration, no Prometheus, no database setup required.
Docker Compose (optional)
If you prefer managing containers with docker-compose, you can use:
version: '3'services: gpu-hot: image: ghcr.io/psalias2006/gpu-hot:latest container_name: gpu-hot ports: - "1312:1312" deploy: resources: reservations: devices: - capabilities: [gpu] restart: unless-stoppedThen run:
docker compose up -dComparison
| Item | nvidia-smi | Prometheus + Grafana | GPU Hot |
|---|---|---|---|
| Deployment | ★☆☆☆☆ (CLI) | ★★★★★ (complex setup) | ★☆☆☆☆ (one line) |
| Historical data | ❌ None | ✅ Yes | ✅ Built-in short-term charts |
| Real-time refresh | ❌ Manual | ✅ Auto | ✅ Auto |
| Visualization | ❌ | ✅ Highly customizable | ✅ Lightweight & clean |
| GPU process details | ✅ | ✅ | ✅ |
| Resource usage | Very low | Medium–high | Low |
| Use cases | Quick ad-hoc checks | Enterprise / cluster monitoring | Personal / small workstations |
From a positioning standpoint, GPU Hot is a very appropriate “middle-ground solution”:
Not as heavyweight as Grafana, but far nicer to look at than nvidia-smi. Ideal for single machines, multi-GPU workstations, or personal servers for day-to-day monitoring.
Real-world experience: pros & cons
Pros:
- One-command deployment, no need to configure exporters or databases
- Automatic multi-GPU detection
- Extremely clean UI with an excellent dark theme
- Smooth real-time charts with low latency
- Runs happily inside official NVIDIA containers
Cons:
- No data persistence or historical querying yet
- NVIDIA GPUs only
- No API interface (in the current version)
Conclusion
If you’re tired of the cumbersome Grafana + Prometheus monitoring stack, or you just want to quickly check GPU load and temperatures, GPU Hot is a small but very worthwhile tool to try out.