Deploy Scrutiny with Docker to Monitor Your Drives
When running a NAS, server, or a home RAID array, drives are the core of your storage stack—both easy to overlook and absolutely critical. Everything seems fine day to day, but when a single drive dies, the cost can be painful: data loss, service downtime, and a lot of stress.
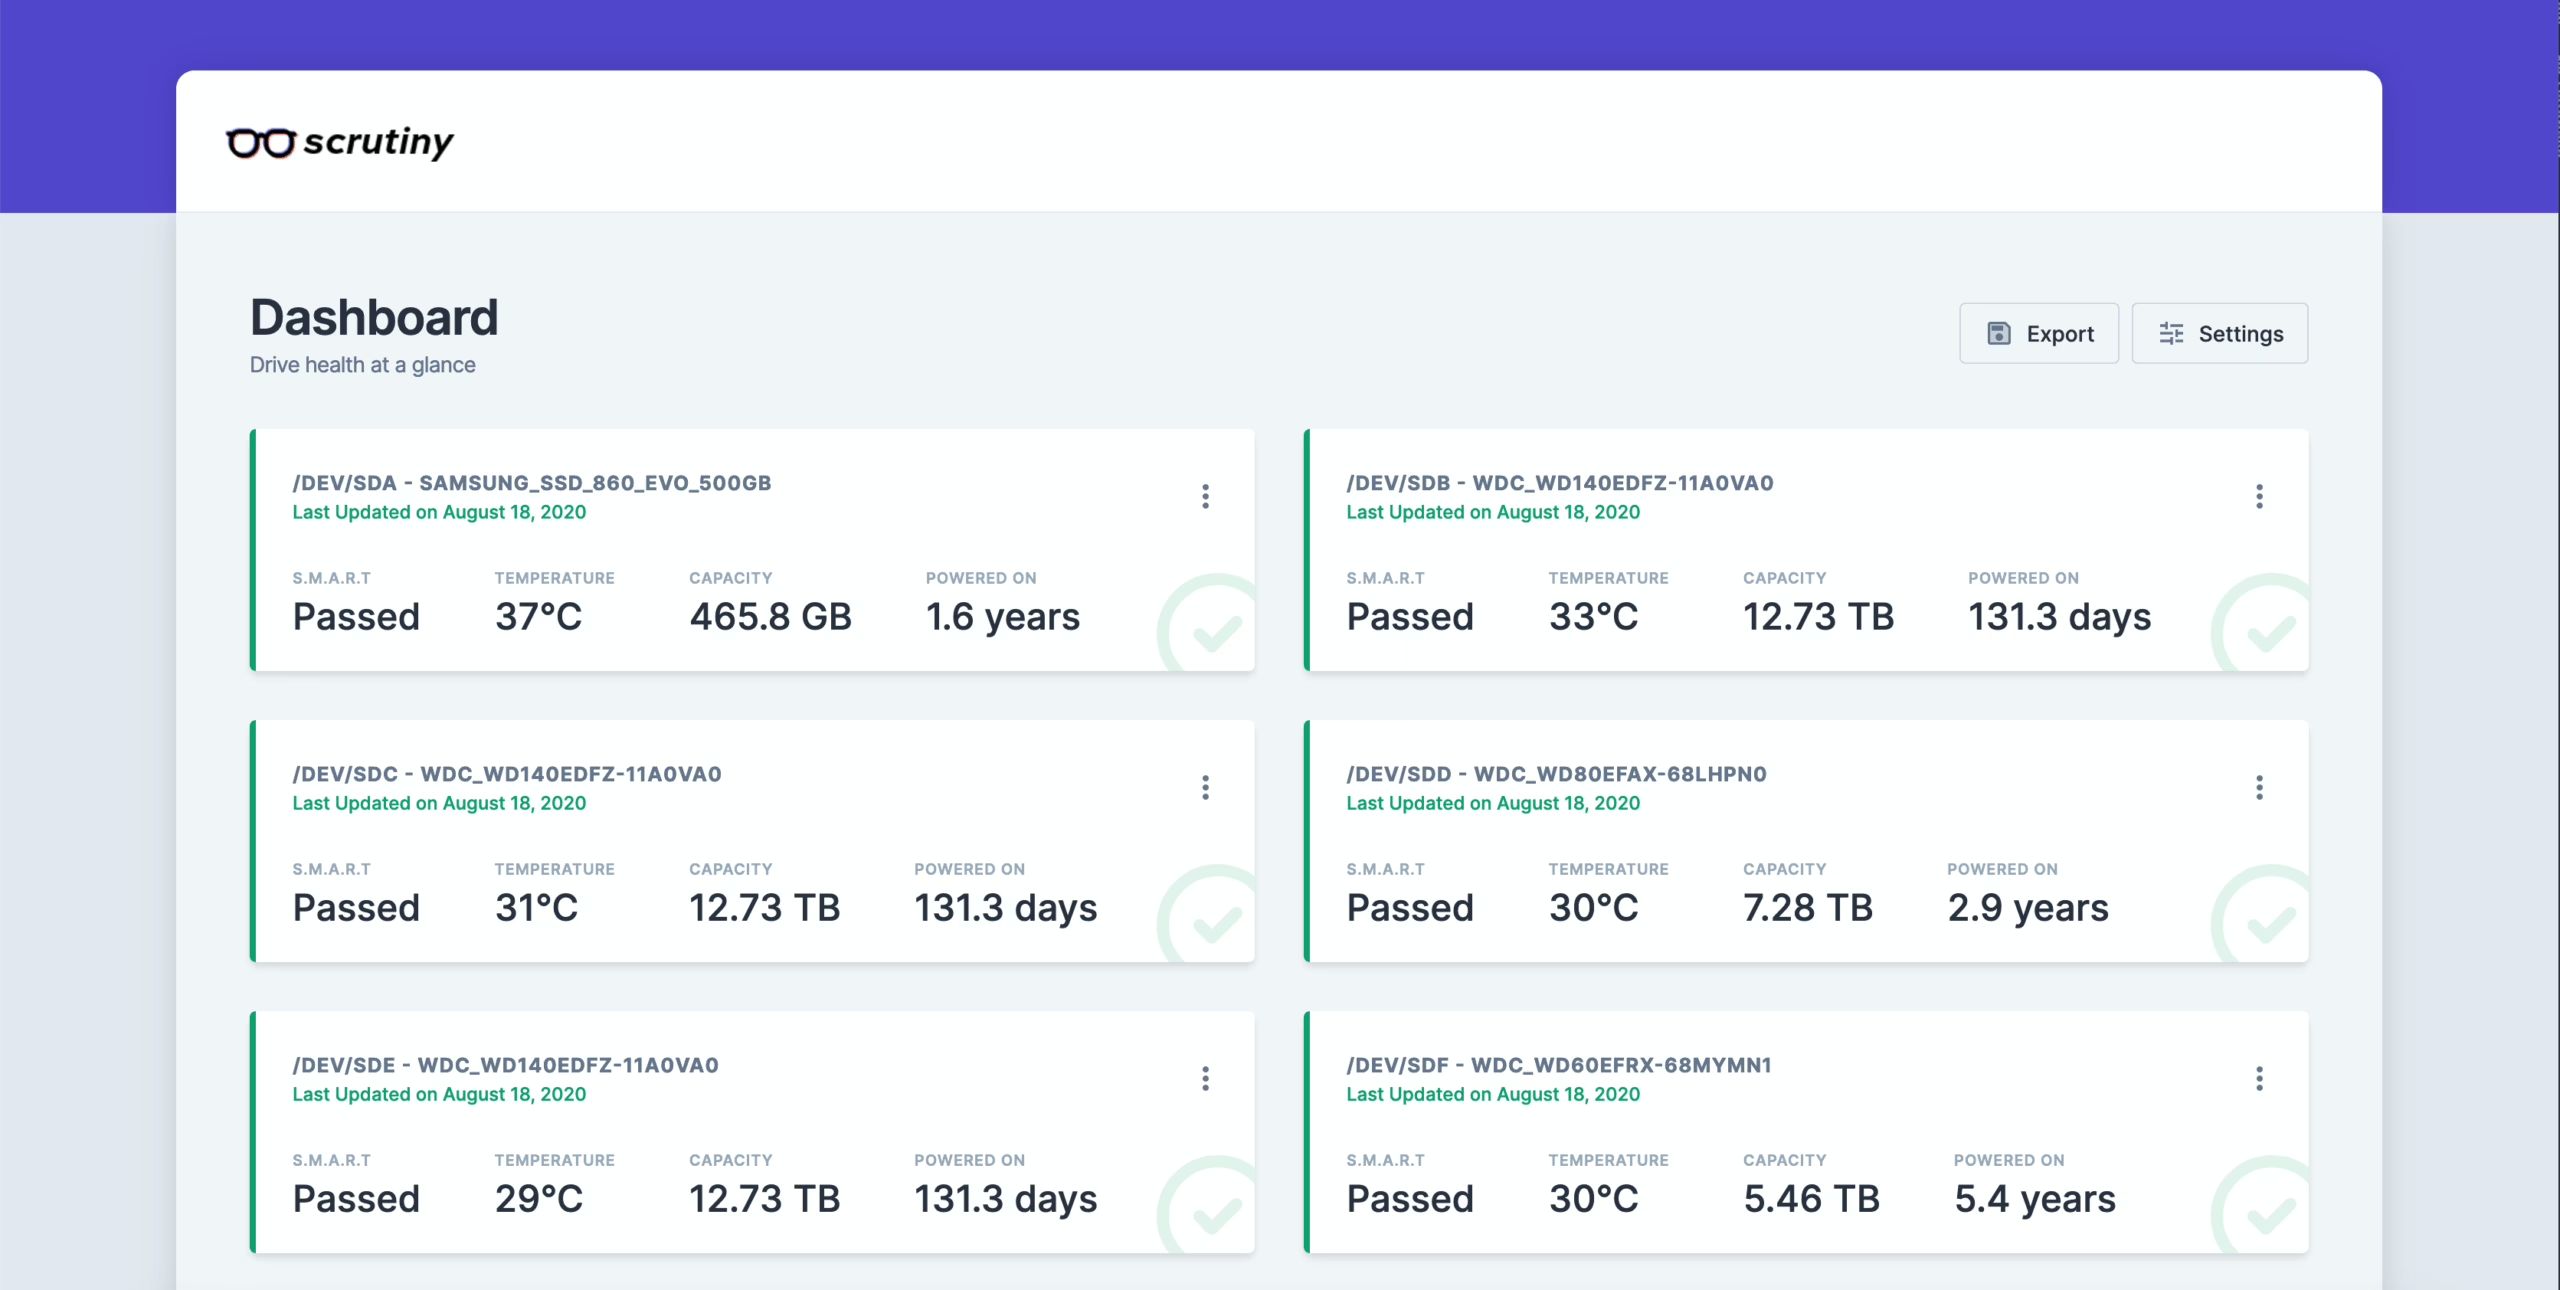
SMART is the built-in self-monitoring technology on most drives, but its raw output is usually noisy, obscure, and not very intuitive. Scrutiny is a lightweight, modern drive monitoring dashboard that visualizes SMART data to show drive health, lifetime trends, and anomaly alerts, with support for email and Webhook notifications.
Features
Scrutiny is a simple yet focused application with the following core features:
-
Web UI dashboard – focused on key metrics
-
smartdintegration -
Automatic detection of all attached drives
-
Historical trend tracking for SMART metrics
-
Thresholds tuned using real-world failure rates
-
Temperature tracking
-
Distributed as an all-in-one Docker image (manual install also available)
-
Alerts/notifications via Webhook configuration
-
(Planned) drive performance testing and tracking
Deployment
Create a directory
请自己找寻合适的位置mkdir Scrutinydocker-compose.yaml
Here you need to fill in the actual device names for your drives. If you’re not sure, run lsblk to check.
If you want to control the monitoring frequency inside Docker, you can add the COLLECTOR_CRON_SCHEDULE environment variable. For example, to collect data every 15 minutes, use -e COLLECTOR_CRON_SCHEDULE="*/15 * * * *". This variable uses standard cron syntax.
version: '3.5'
services: scrutiny: container_name: scrutiny image: ghcr.io/analogj/scrutiny:master-omnibus cap_add: - SYS_RAWIO # 获取机械硬盘的S.M.A.R.T 信息,默认即可 - SYS_ADMIN # 获取NVMe硬盘的S.M.A.R.T 信息,没有可以删除 ports: - "8183:8080" # webapp - "8184:8086" # influxDB admin(可以不映射) volumes: - /run/udev:/run/udev:ro - ./config:/opt/scrutiny/config - ./influxdb:/opt/scrutiny/influxdb devices: - "/dev/sda" - "/dev/sdb" - "/dev/sdc" - "/dev/sdd"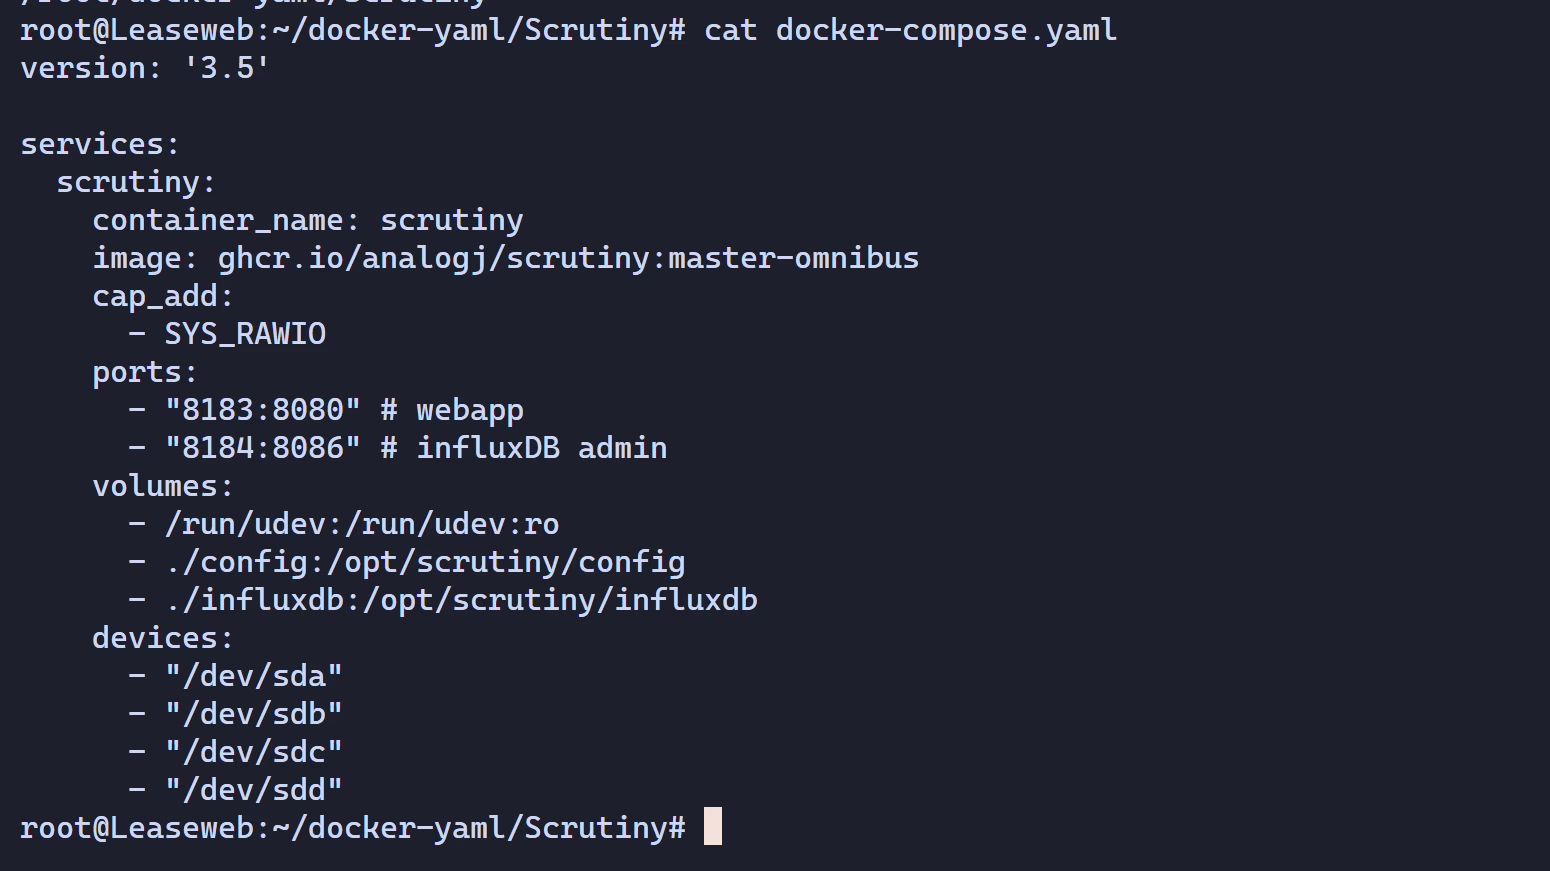
Start the stack
docker compose up -d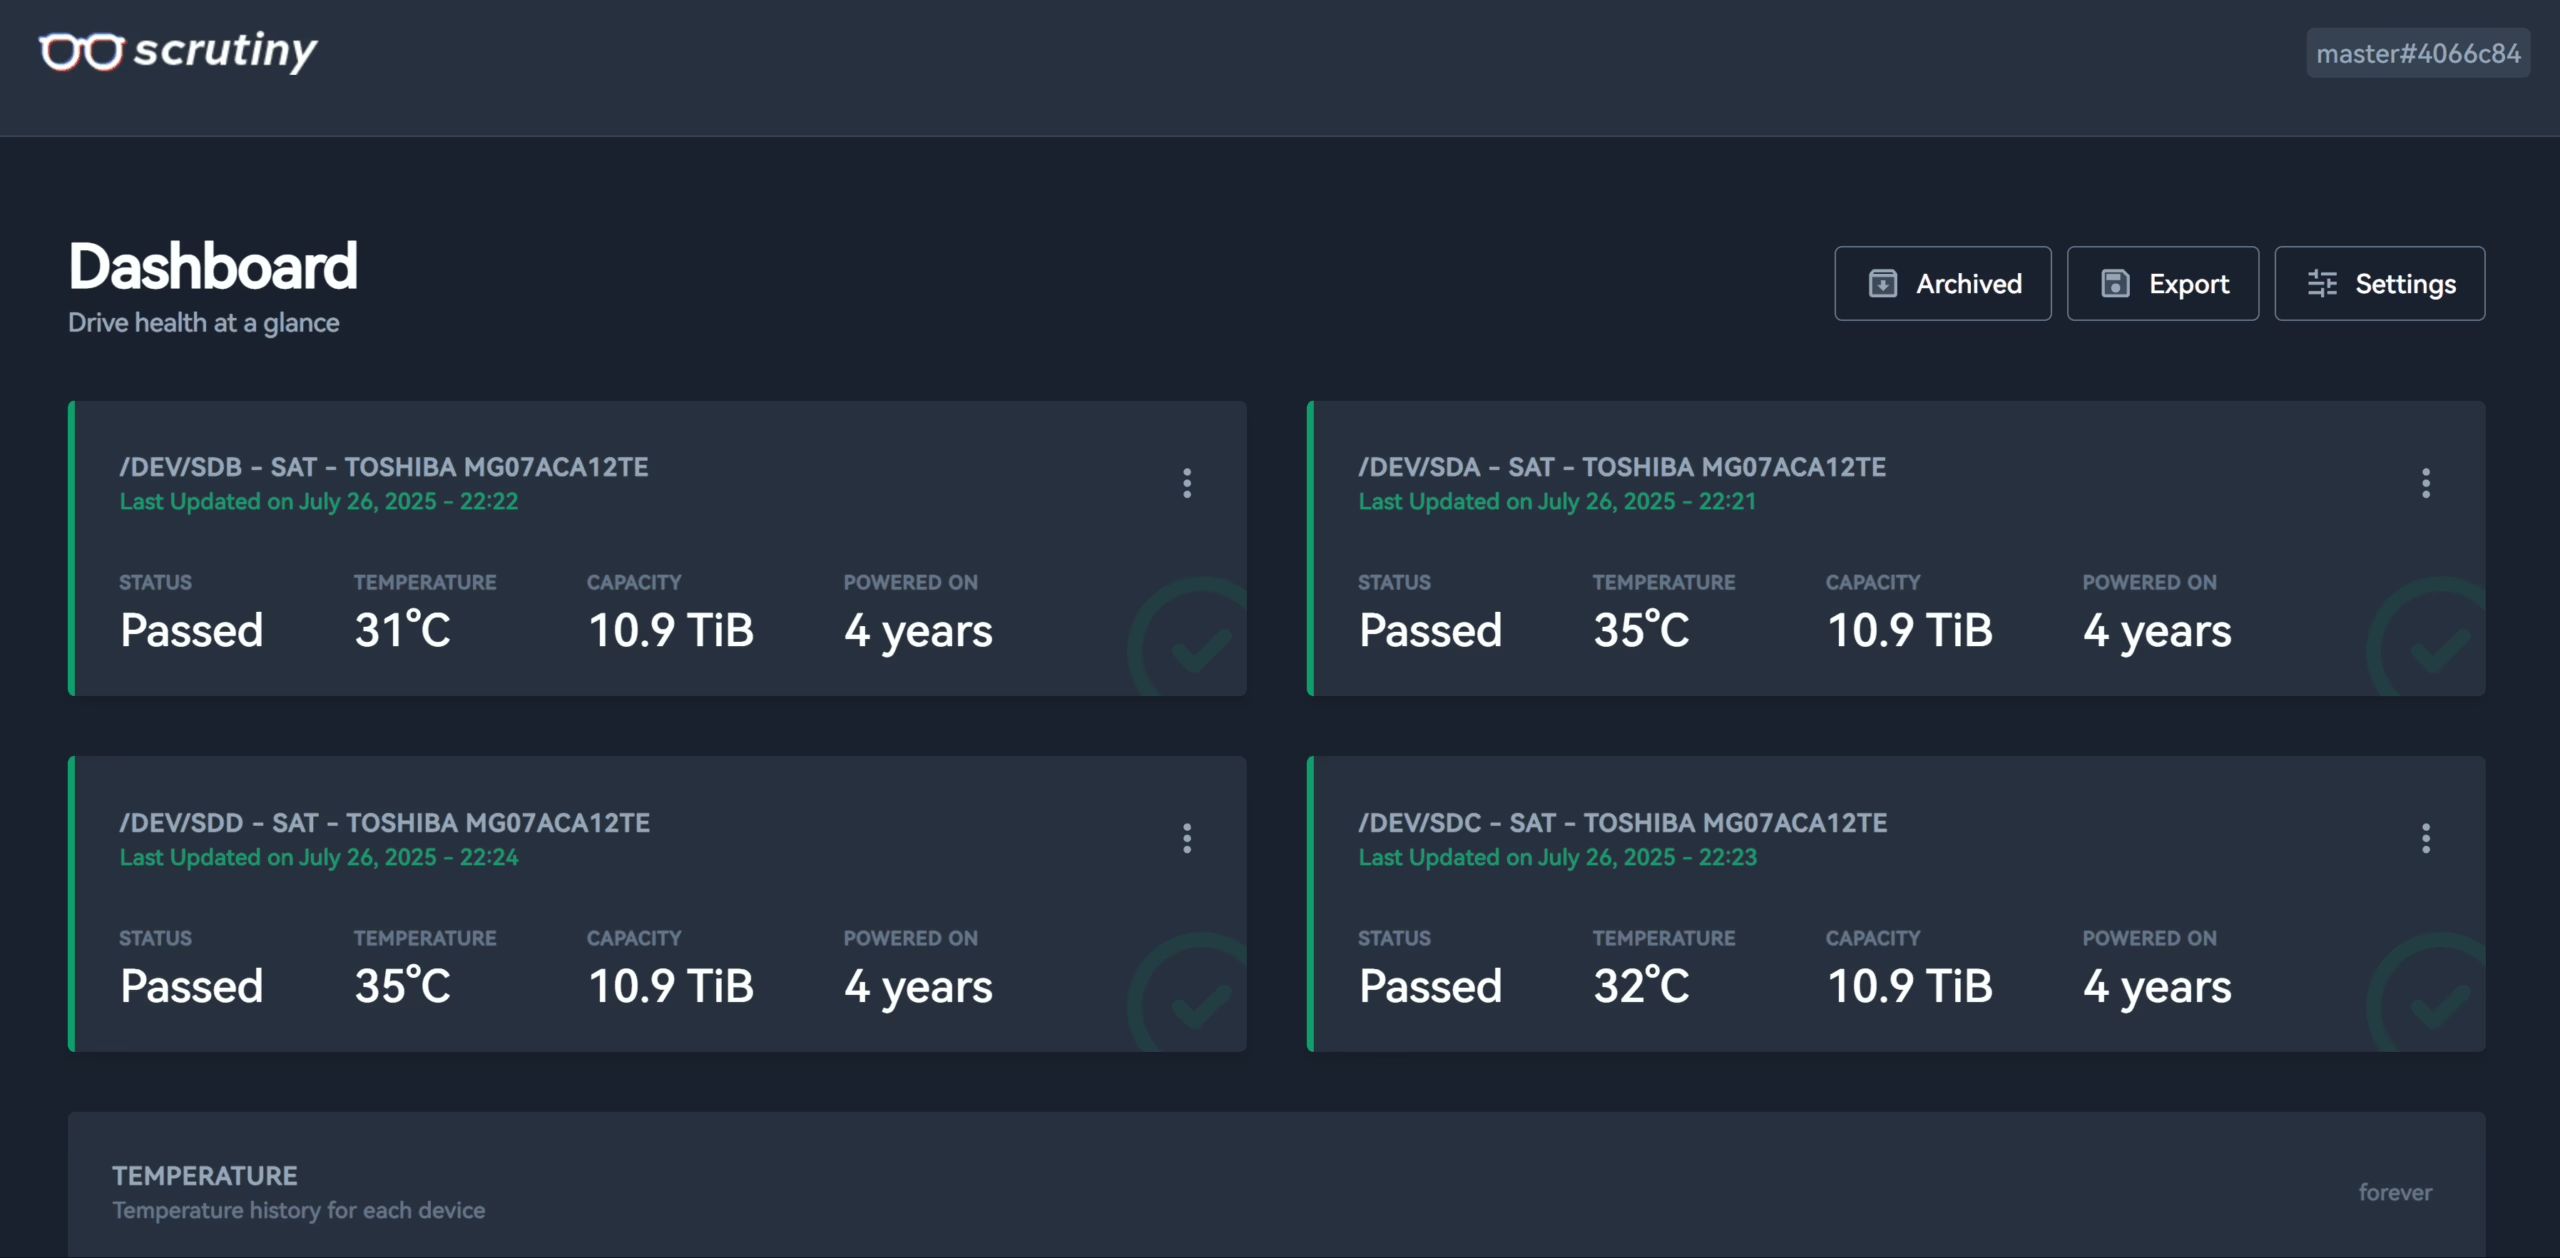
Configure notifications
Just create a new scrutiny.yaml file under $PWD/scrutiny and add the following content:
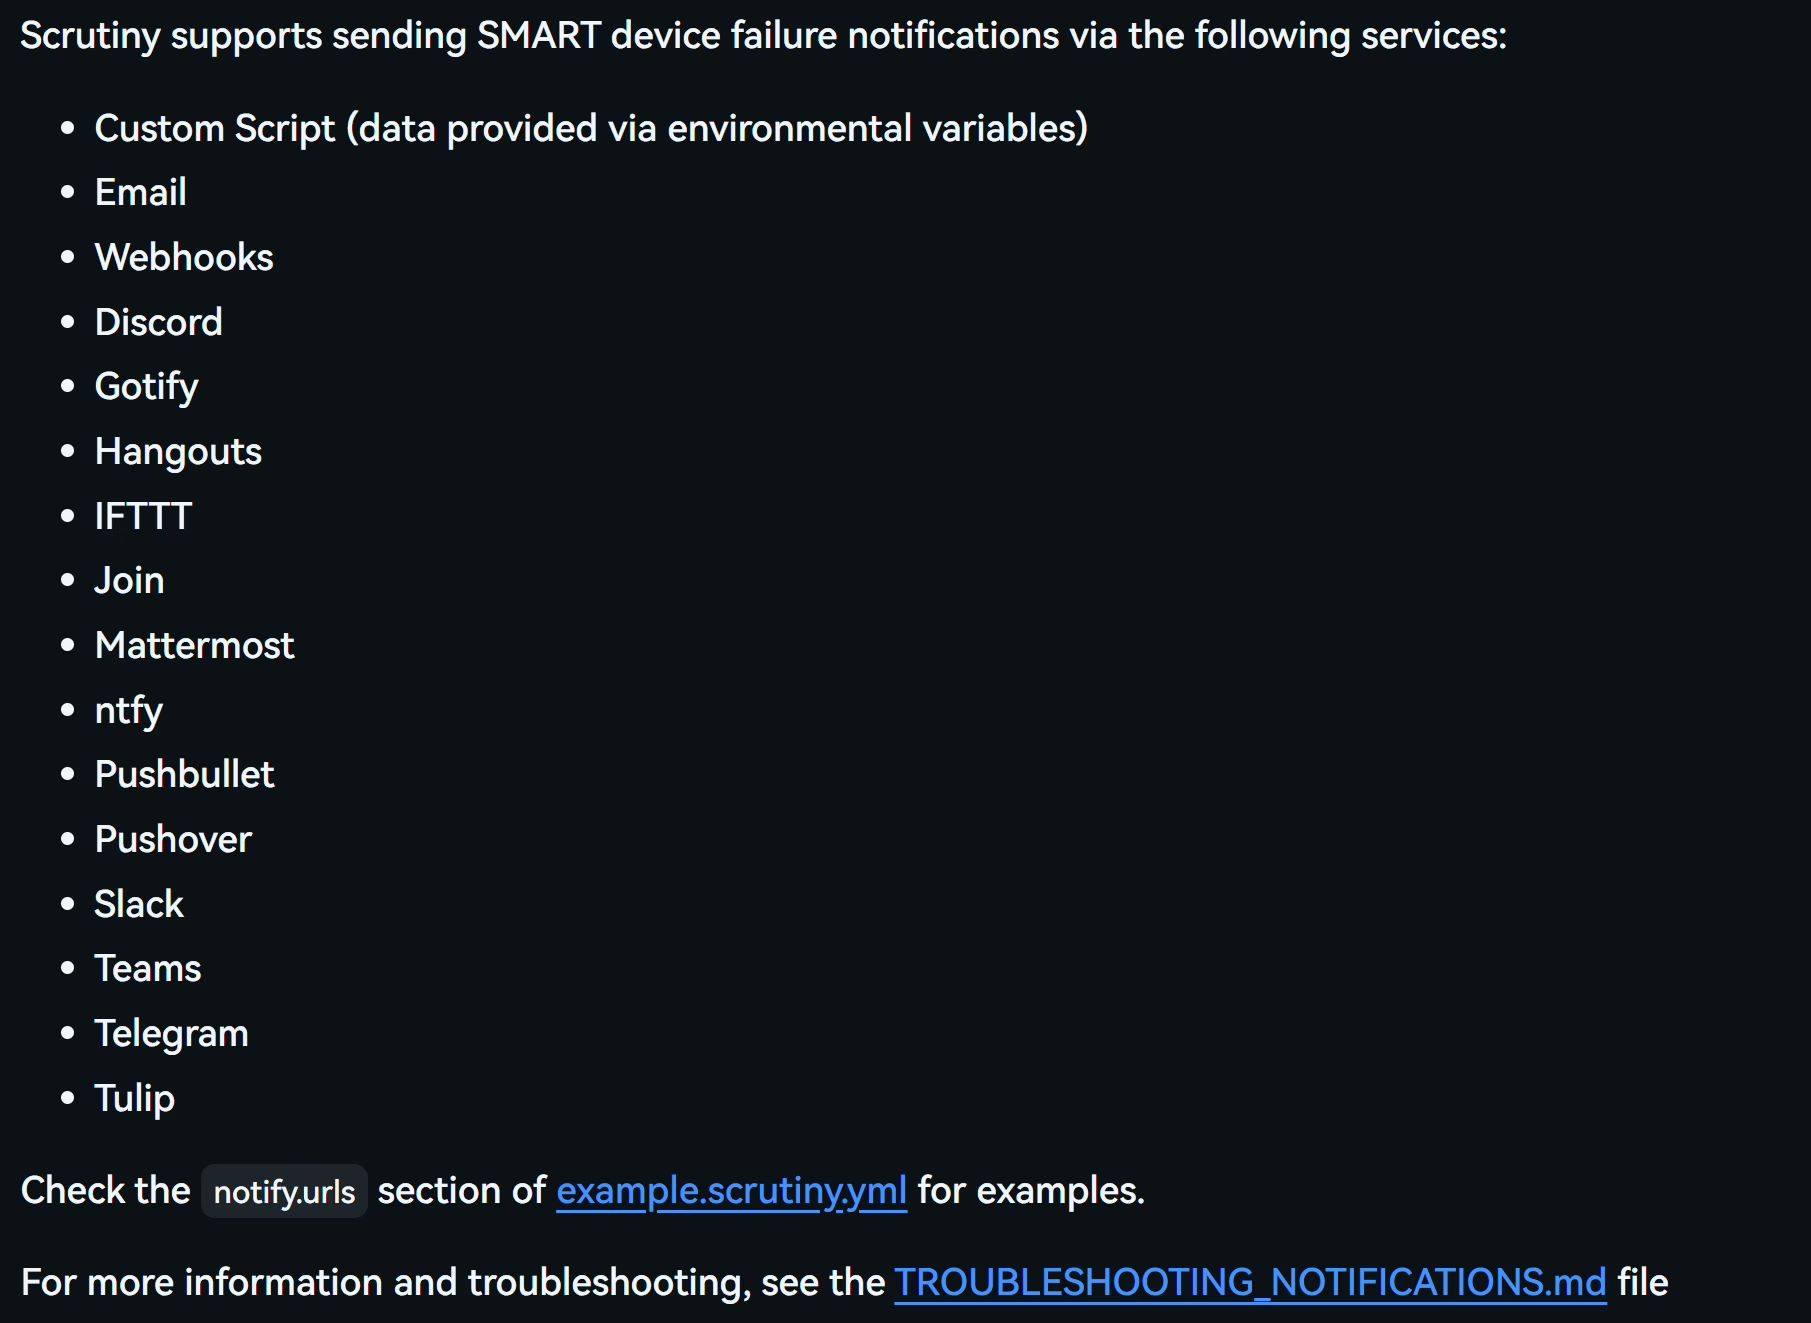
notify: urls: - "telegram://token@telegram?channels=channel-1[,channel-2,...]"For more detailed notification configuration, see https://github.com/AnalogJ/scrutiny#notifications
There are many supported notification types and channels; you can tune them based on how critical your drives are.
Summary
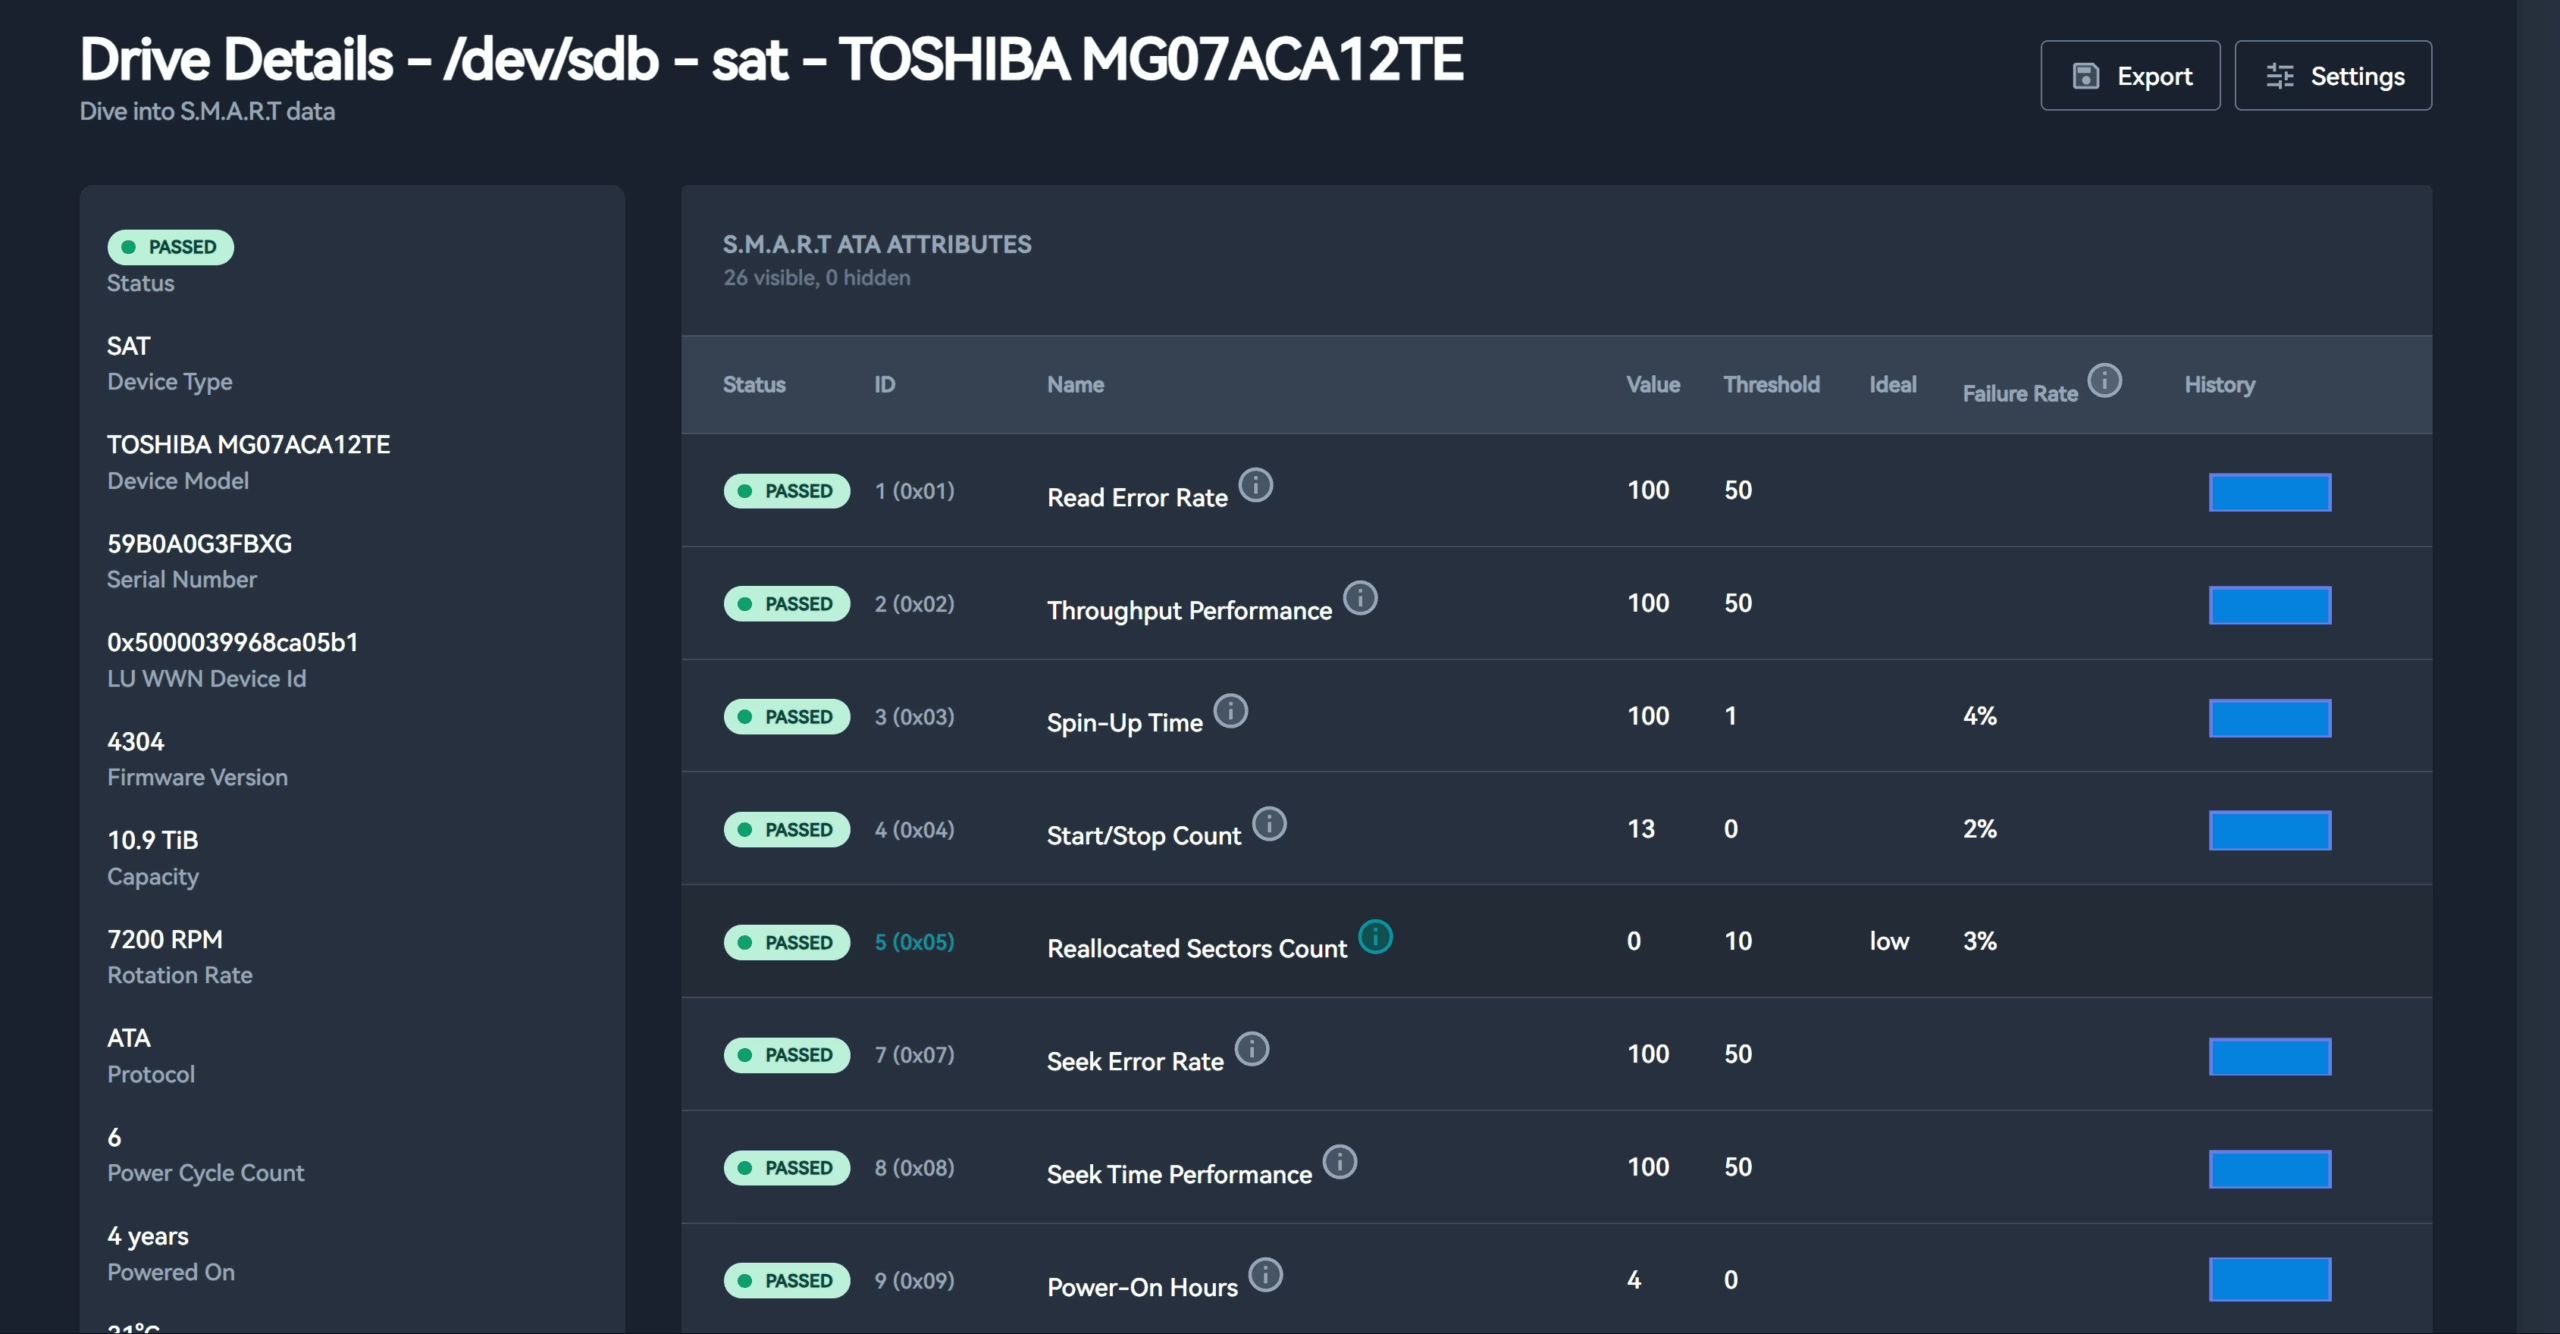
Although SMART data is easy to access and is supported by almost all modern HDDs and SSDs, it’s not very user-friendly in practice. You can use CLI tools like smartctl to check each disk’s health, temperature, reallocated sectors, power-on hours, and more—but as soon as you have multiple drives, or even multiple hosts, managing all this data becomes tedious.
You end up SSH-ing into each host, running commands manually, copying outputs, then comparing and analyzing them to see if anything looks off. This workflow is not only inefficient, it’s error-prone. And when you actually need this data—say, when a drive starts throwing errors, the system slows down, or your RAID suddenly goes degraded—scrambling to inspect SMART at that point feels like too little, too late.
This is where Scrutiny shines. It can periodically collect SMART data from all your drives, aggregate it, and present everything on a modern, graphical web dashboard. It runs cross-platform and supports multiple notification channels (Email, Slack, Telegram, Webhook, etc.), so you can truly get early warning before a drive fails. What used to require checking each disk via the command line is now visible at a glance—greatly improving efficiency and taking readability to another level.