Using Thanos to Manage Multiple Prometheus Data Sources for High Availability
Introduction
Thanos is a monitoring solution built on top of Prometheus that adds centralized querying and long‑term storage capabilities to Prometheus. With Thanos, you can sync metrics collected by one or more Prometheus instances to object storage (such as S3‑compatible object storage), and then run global PromQL queries by connecting to that object storage. Thanos consists of multiple microservice components; here we will use Thanos Sidecar, Thanos Store, and Thanos Query:
-
Thanos Sidecar: Runs on the same host as Prometheus, connects to object storage, and automatically uploads each TSDB block generated by Prometheus to object storage.
-
Thanos Store: Connects to object storage and serves queries against the data stored there.
-
Thanos Query: Aggregates multiple Thanos components as data sources and executes queries over the combined data.
-
Thanos Query Frontend: Improves Query performance.
-
Thanos Compactor: Compacts and downsamples data in object storage.
-
Thanos Ruler: Manages and evaluates alerting rules.
-
Thanos Receive: Receives data from Prometheus Remote Write.
Each Thanos component exposes both a PromQL HTTP API and a Thanos StoreAPI gRPC interface. This means you can either cascade Thanos components via Thanos Query, or connect any individual Thanos component instance directly to Grafana.
Deployment
[Note] Starting from the release-0.11 version, NetworkPolicy manifests were added and by default only allow intra‑component access. If you understand NetworkPolicy, you can adjust the default rules (see ls manifests/*networkPolicy*). If you leave them as is, changing Services to NodePort will still not make them reachable. If you are not familiar with NetworkPolicy, you can simply delete those manifests.
Change image registry mirror
# Searchgrep -rn 'quay.io' *# Batch replacesed -i 's/quay.io/quay.mirrors.ustc.edu.cn/g' `grep "quay.io" -rl *`# Verifygrep -rn 'quay.io' *grep -rn 'image: ' *Modify the Prometheus Service
# Expose it via NodePort by adding the following two lines; full config shown below.# type: NodePort# nodePort: 30090
vi manifests/prometheus-service.yaml
apiVersion: v1kind: Servicemetadata: labels: app.kubernetes.io/component: prometheus app.kubernetes.io/instance: k8s app.kubernetes.io/name: prometheus app.kubernetes.io/part-of: kube-prometheus app.kubernetes.io/version: 2.53.0 name: prometheus-k8s namespace: monitoringspec: type: NodePort ports: - name: web port: 9090 targetPort: web nodePort: 30090 - name: reloader-web port: 8080 targetPort: reloader-web selector: app.kubernetes.io/component: prometheus app.kubernetes.io/instance: k8s app.kubernetes.io/name: prometheus app.kubernetes.io/part-of: kube-prometheus sessionAffinity: ClientIPModify the Grafana Service
# Expose it via NodePort by adding the following two lines; full config shown below.# type: NodePort# nodePort: 30300vi manifests/grafana-service.yaml
apiVersion: v1kind: Servicemetadata: labels: app.kubernetes.io/component: grafana app.kubernetes.io/name: grafana app.kubernetes.io/part-of: kube-prometheus app.kubernetes.io/version: 11.1.0 name: grafana namespace: monitoringspec: type: NodePort ports: - name: http port: 3000 targetPort: http nodePort: 30300 selector: app.kubernetes.io/component: grafana app.kubernetes.io/name: grafana app.kubernetes.io/part-of: kube-prometheusModify the Alertmanager Service
apiVersion: v1kind: Servicemetadata: labels: app.kubernetes.io/component: alert-router app.kubernetes.io/instance: main app.kubernetes.io/name: alertmanager app.kubernetes.io/part-of: kube-prometheus app.kubernetes.io/version: 0.27.0 name: alertmanager-main namespace: monitoringspec: type: NodePort ports: - name: web port: 9093 targetPort: web nodePort: 30093 - name: reloader-web port: 8080 targetPort: reloader-web selector: app.kubernetes.io/component: alert-router app.kubernetes.io/instance: main app.kubernetes.io/name: alertmanager app.kubernetes.io/part-of: kube-prometheus sessionAffinity: ClientIPTo reduce costs, we use a self‑hosted MinIO instance as object storage instead of S3/OSS services. The MinIO deployment itself is not covered here.
git clone https://github.com/Yuri-NagaSaki/Prometheus-Operator-Thanos.gitcd Prometheus-Operator-ThanosCreate CRDs
kubectl create -f setup/Create all base components
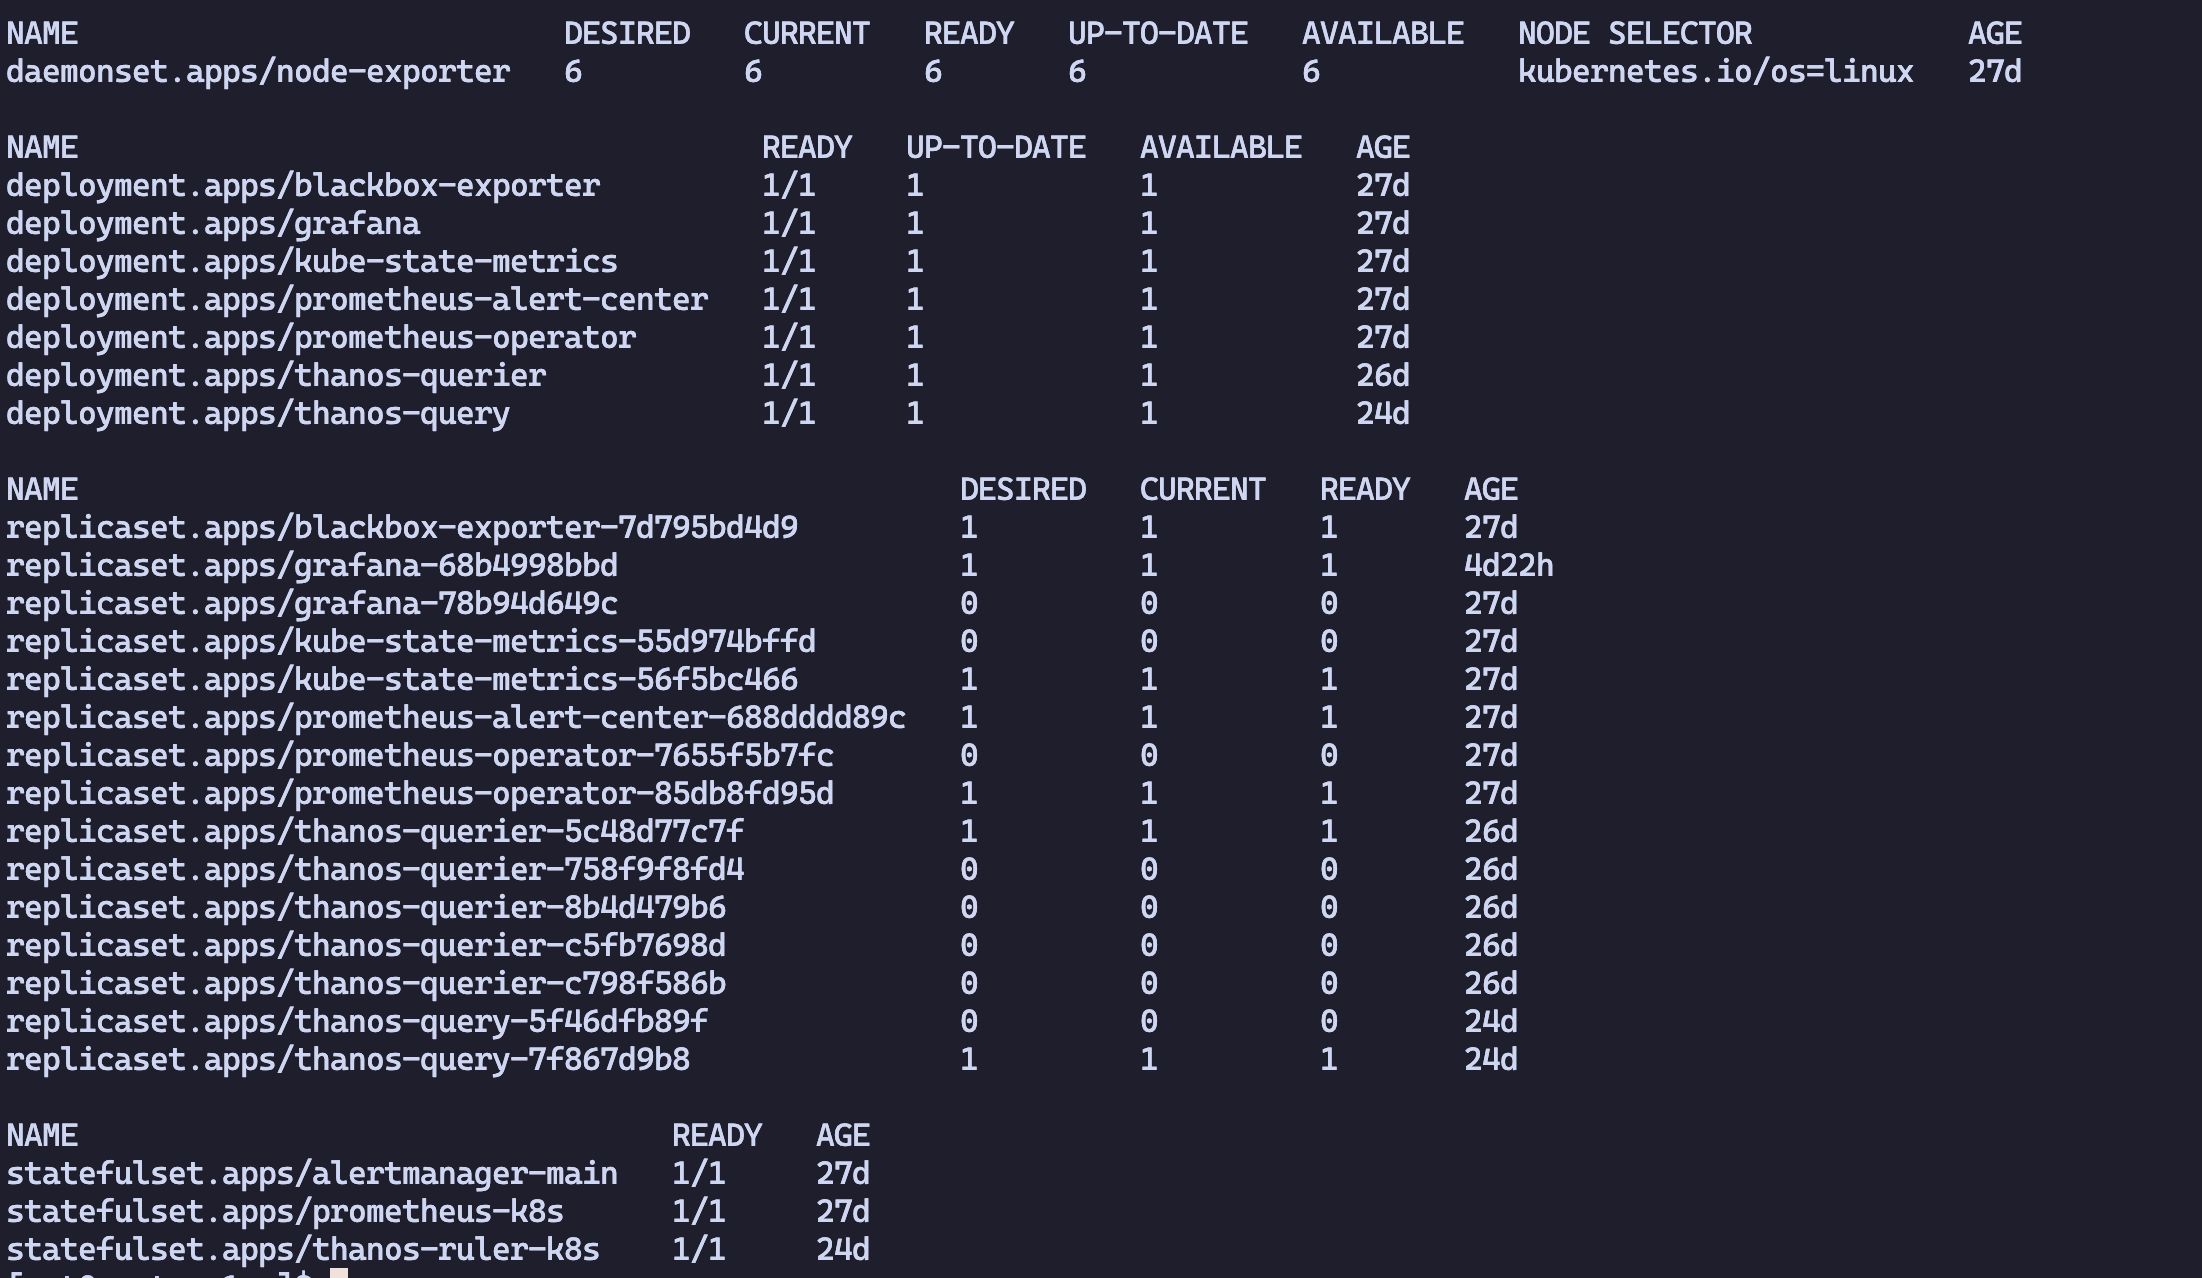
kubectl apply -f .After creation, the following new Kinds will be available:
-
Alertmanager
-
PodMonitor
-
Probe
-
Prometheus
-
PrometheusRule
-
ServiceMonitor
-
ThanosRuler
Update Prometheus configuration
kubectl create -f thanos/Create Thanos modules (choose the Thanos mode you want to use)
kubectl create -f thanos/thanos-sidecarkubectl create -f thanos/thanos-receiveCreate rules as needed
kubectl create -f thanos/rules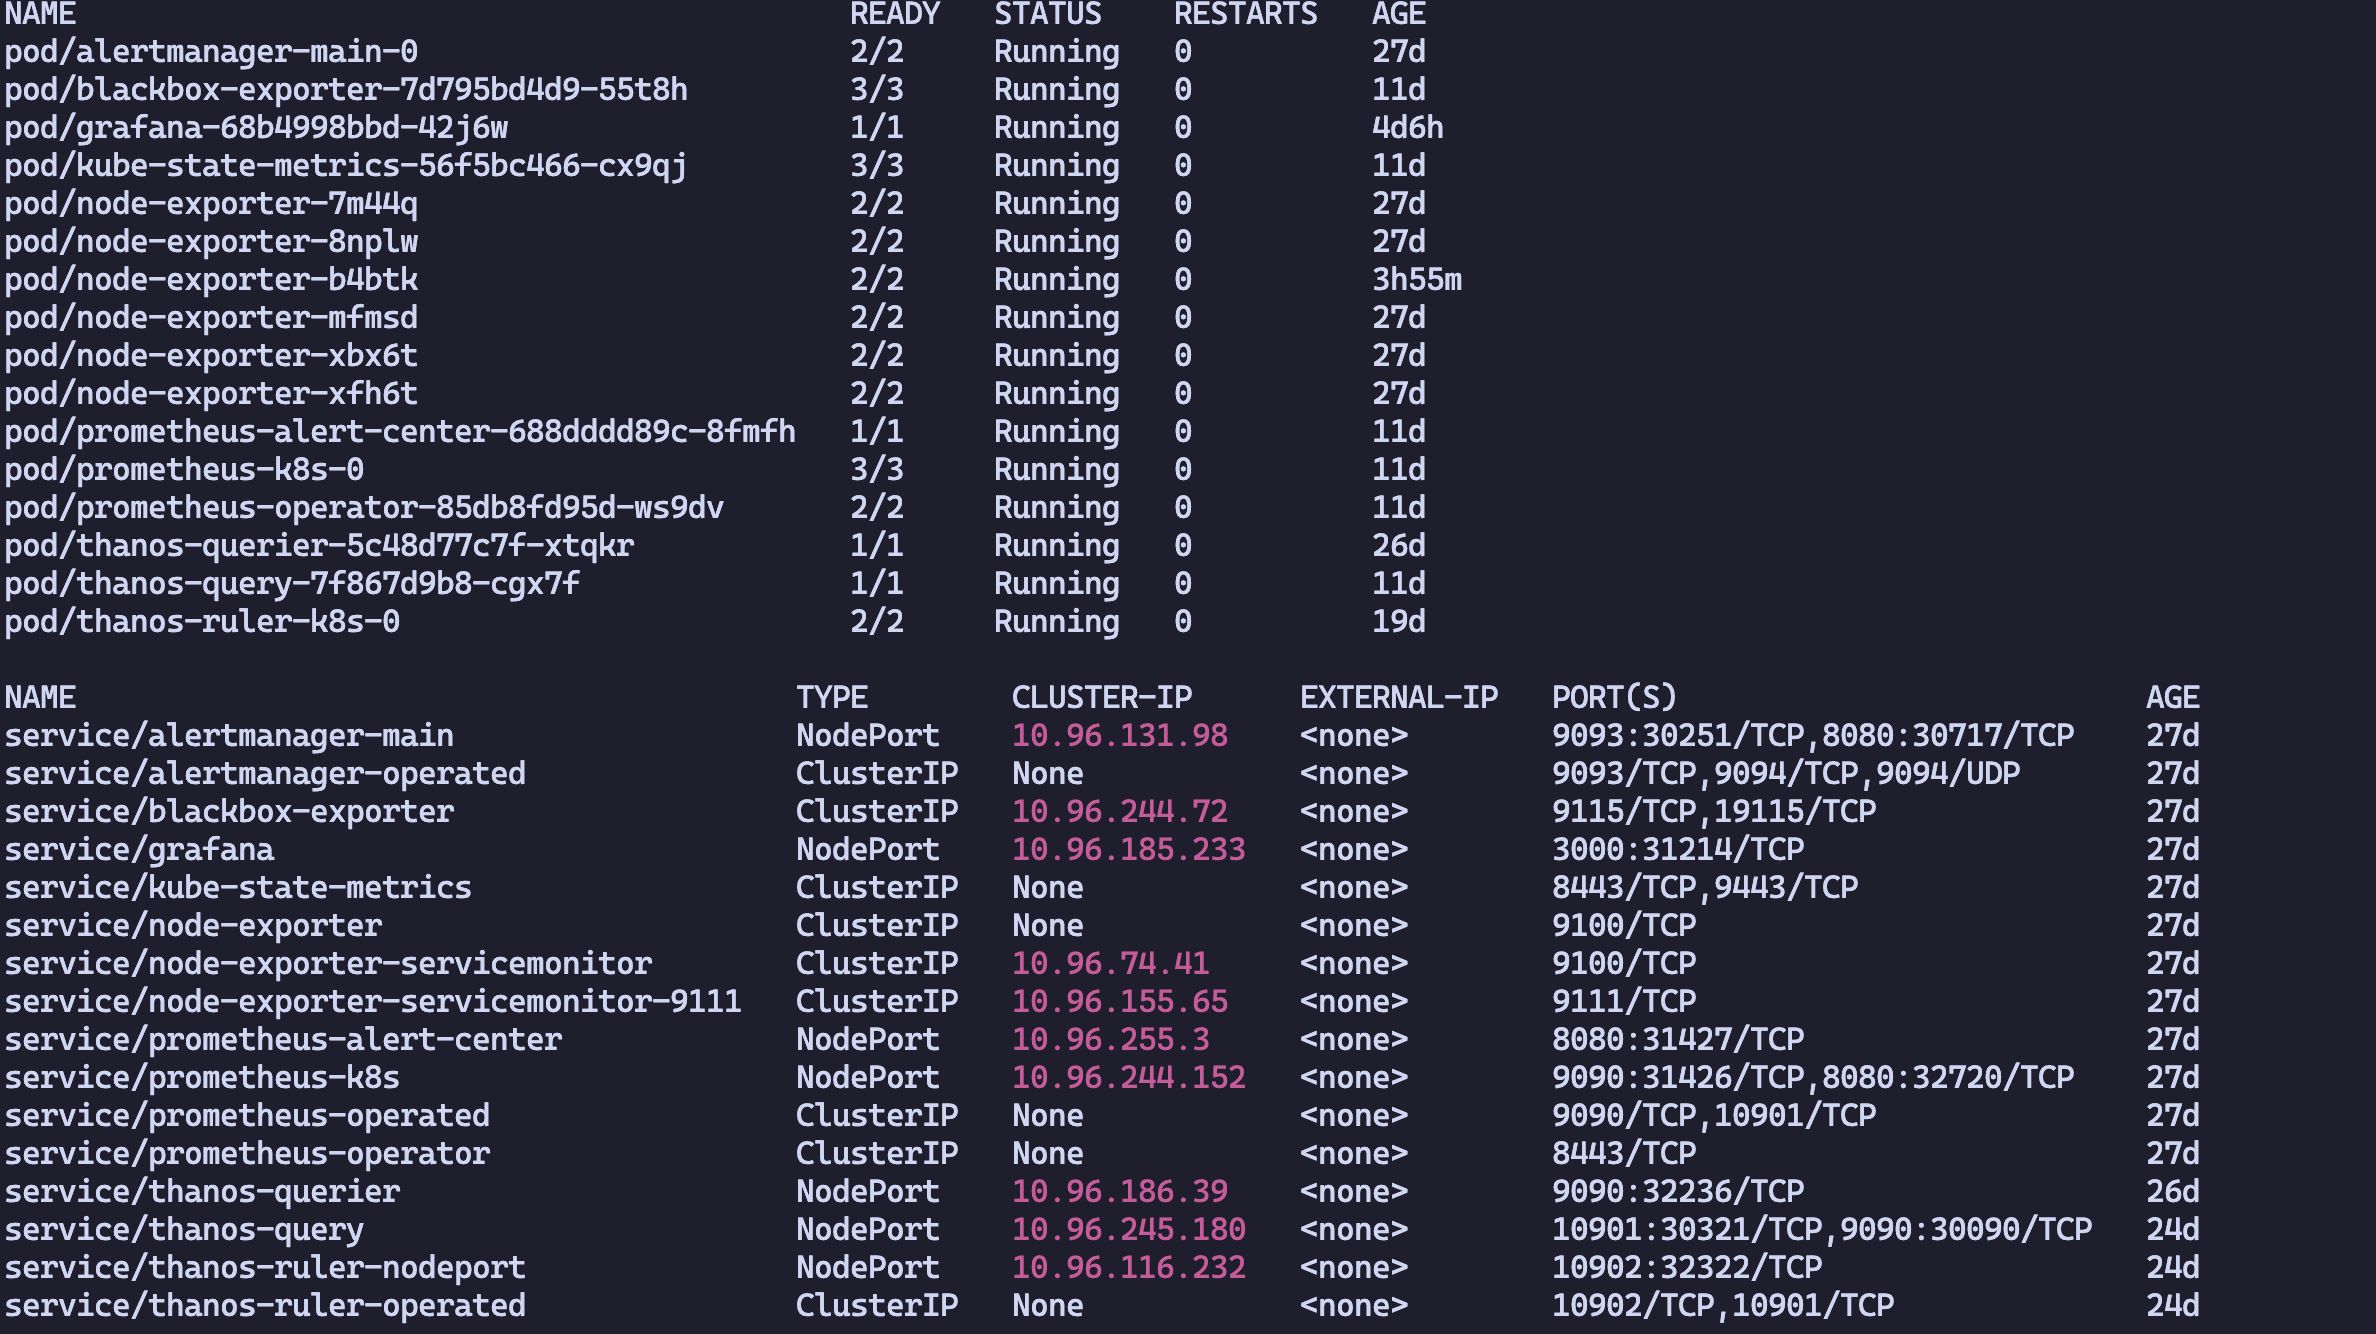
Notes
reading meta file failed, will override it” err=”failed to read /prometheus/thanos.shipper.json: open /prometheus/thanos.shipper.json: no such file or directory”
Solution:
When using the Thanos Sidecar mode, the Sidecar reads the thanos.shipper.json file under the Prometheus data directory. This file is used to track what has been uploaded to object storage; the Sidecar updates it whenever it uploads data.
The error above usually occurs because thanos.shipper.json is owned by root, so the Sidecar does not have sufficient permissions to read or write it. Since the Sidecar itself does not retry reading, simply chown‑ing the file inside the container will not help. You need to persist Prometheus’s data directory, grant 777 permissions to this file on the host, and then restart the entire Prometheus Pod.