Docker Deploy Prometheus, Node Exporter, Grafana and cAdvisor (2023)
Docker compose file
git clone https://github.com/Sayyiku/DataEye.gitmkdir -p promgrafnode/prometheusmkdir -p promgrafnode/grafana/provisioningtouch promgrafnode/docker-compose.ymltouch promgrafnode/prometheus/prometheus.yml
docker-compose up -d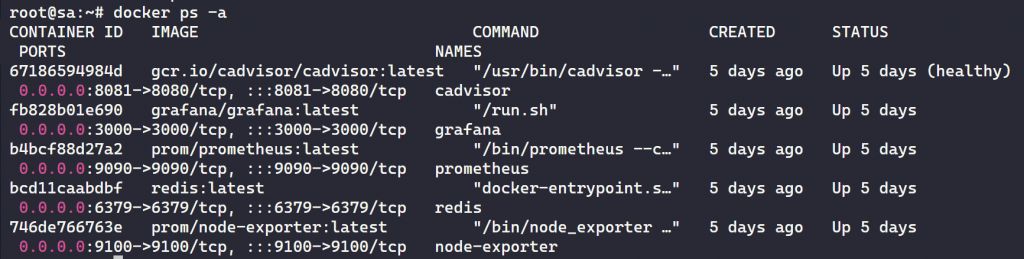
Node Exporter deployment on monitored hosts
docker run -d -p 9100:9100 \ -v "/root/docker/node-exporter/proc:/host/proc:ro" \ -v "/root/docker/node-exporter/sys:/host/sys:ro" \ -v "/root/docker/node-exporter/:/rootfs:ro" \ --net="host" \ --name node-exporter \ prom/node-exporterprometheus.yml
global: scrape_interval: 1m
scrape_configs: - job_name: "prometheus" scrape_interval: 1m static_configs: - targets: ["localhost:9090"]
- job_name: "node" static_configs: - targets: ["node-exporter:9100"]
- job_name: "cadvisor" scrape_interval: 5s static_configs: - targets: ["your ip:8081"]
- job_name: "AWS-SG" scrape_interval: 5s static_configs: - targets: ["your ip:9100"]
- job_name: "Spaceberg-20T" scrape_interval: 5s static_configs: - targets: ["your ip:9100"]Prometheus and Node Exporter architecture
Prometheus and Node Exporter work together. You can run Prometheus and Node Exporter on the same machine. However, in most cases you will want to run Node Exporter on multiple remote Linux hosts.
Once Node Exporter is installed, you can reference the Node Exporter instances and all the nodes you want to monitor in the Prometheus configuration file. These might be Linux VMs running in your environment.
Prometheus scrapes data from the Node Exporter HTTP endpoints exposed on the remote hosts. You can enable additional collectors, gather the metrics you need, and access these metrics through Prometheus.
The Prometheus UI allows you to view service discovery and test the targets you’ve added to the Prometheus configuration. In the Prometheus configuration file, you define the endpoints and ports that connect the Prometheus server to the configured Node Exporter instances. Likewise, you can verify these connections from the Prometheus UI.
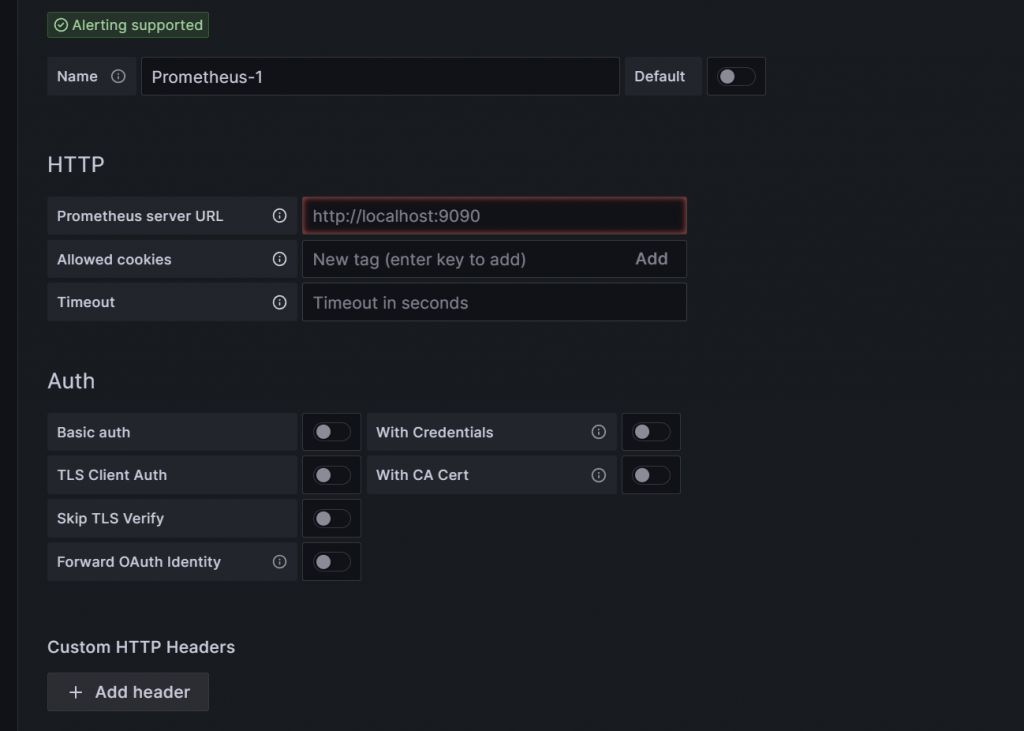
Configuring Grafana using the Prometheus server URL
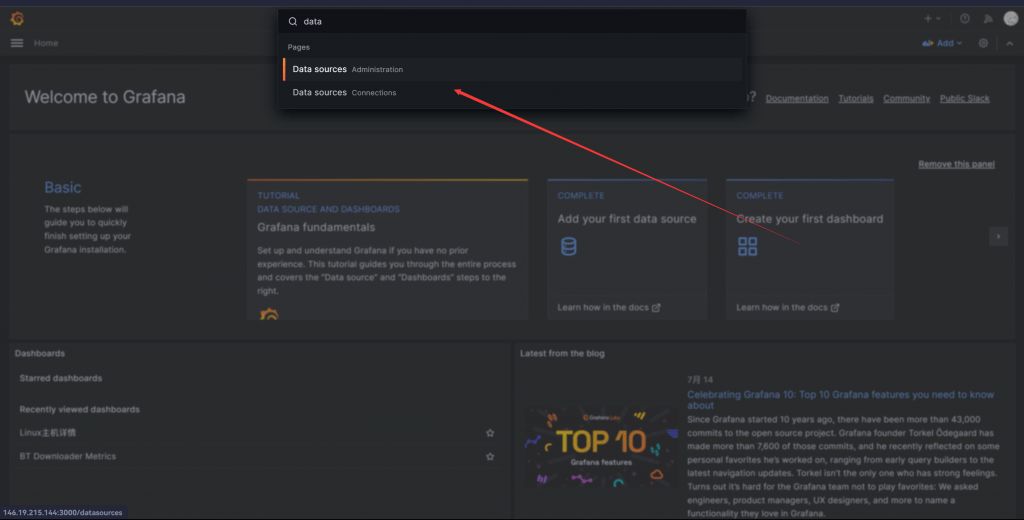
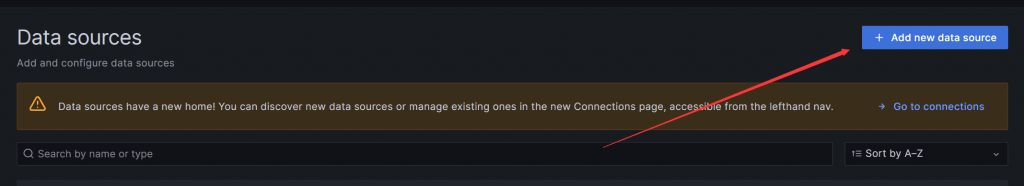
After the containers are up and running, you need to add Prometheus as a data source in Grafana. Open Grafana and click the settings gear in the lower-left corner. Then click Prometheus and configure Grafana using the URL of your Prometheus server.
Add data source
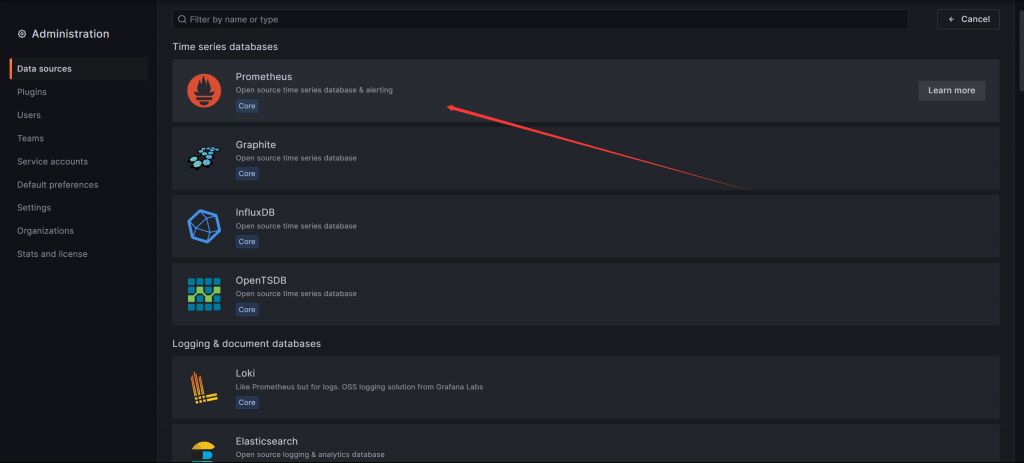
Add the IP and port of the Prometheus server URL to scrape metrics in Prometheus format.
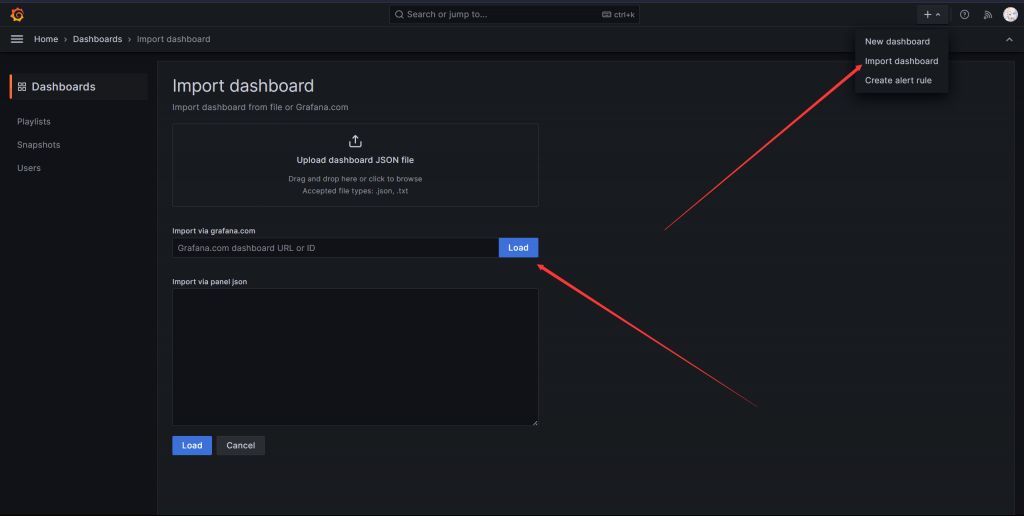
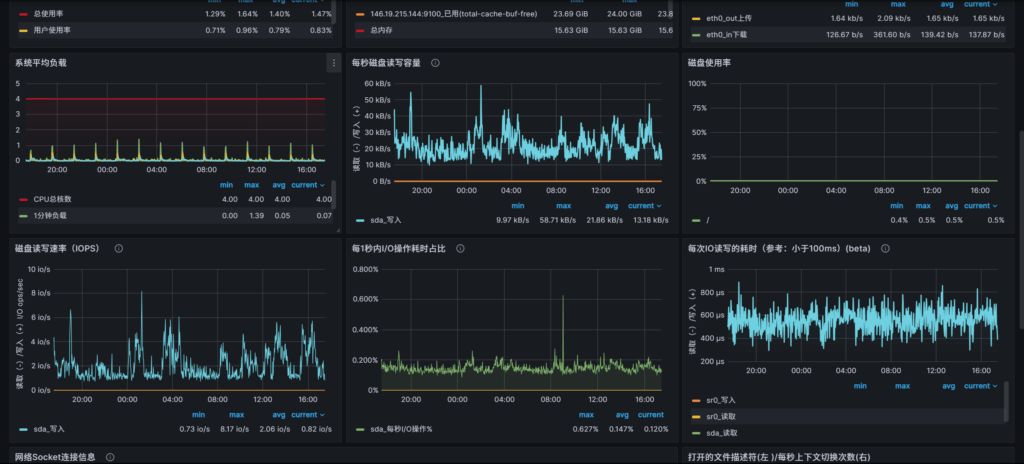
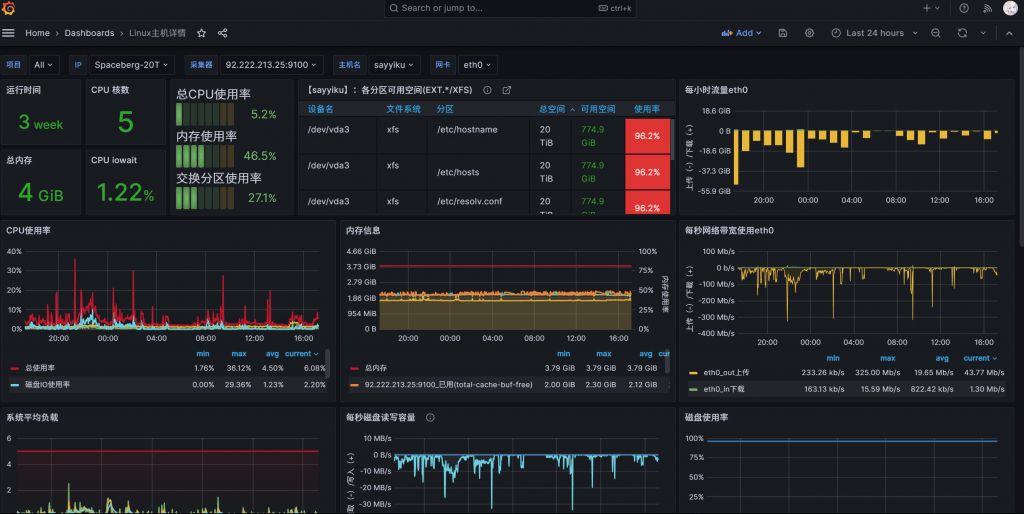
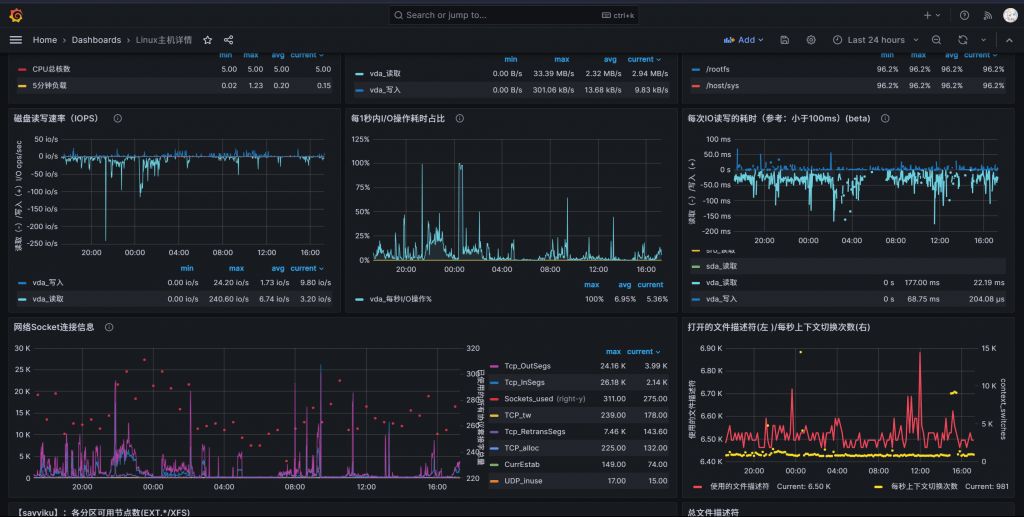
Visualizing Prometheus Node Exporter metrics as a Grafana dashboard
On Grafana.com, you can download an ID or JSON template to quickly create dashboards, saving you from the heavy lifting of building them manually.